X Intrinsic Value Calculation – KeyCorp Drops Q3 2023 EPS Estimates for United States Steel Co
July 22, 2023

☀️Trending News
KeyCorp analysts recently revised their Q3 2023 EPS forecast for United States Steel ($NYSE:X) Co. in a report. United States Steel Corporation (NYSE: X) is the largest integrated steel producer in the United States and one of the world’s leading producers of flat-rolled and tubular steel products. The report noted that KeyCorp analysts had reduced their estimates for the company’s earnings per share in the upcoming quarter. This downward revision comes at a time when the steel industry as a whole is facing economic uncertainty and geopolitical tensions, leading to lessened demand for steel products.
These headwinds are likely to affect United States Steel Co.’s ability to generate profits in the coming quarter. Investors should remain cautious while evaluating this recent news, as any further decrease in United States Steel Co.’s EPS estimates could have a significant impact on the company’s stock price. Analysts will be closely monitoring the steel industry’s performance in the coming months to help determine the full impact of this downward revision.
Earnings
In the earning report of FY2023 Q3 ending September 30, 2023, United States Steel Co. (USS) saw a decrease in earnings as estimated by KeyCorp. Despite this gradual increase, the drop in earnings in the recent quarter has caused KeyCorp to lower their EPS estimates for the company. It remains to be seen how USS will fare in the coming quarters and how these developments will affect its growth and stock prices.
About the Company
Income Snapshot
Below shows the total revenue, net income and net margin for X. More…
| Total Revenues | Net Income | Net Margin |
| 20.3k | 1.84k | 9.8% |
Cash Flow Snapshot
Below shows the cash from operations, investing and financing for X. More…
| Operations | Investing | Financing |
| 2.92k | -2.06k | -914 |
Balance Sheet Snapshot
Below shows the total assets, liabilities and book value per share for X. More…
| Total Assets | Total Liabilities | Book Value Per Share |
| 19.54k | 9.14k | 45.09 |
Key Ratios Snapshot
Some of the financial key ratios for X are shown below. More…
| 3Y Rev Growth | 3Y Operating Profit Growth | Operating Margin |
| 18.5% | 64.7% | 12.0% |
| FCF Margin | ROE | ROA |
| 3.7% | 14.9% | 7.8% |
Stock Price
On Friday, stocks of United States Steel Co (X) opened at $24.7 and closed at $24.2, representing a 1.8% decrease in the stock price from the previous closing price of $24.7. The decrease in the stock price also reflects the current bearish sentiment surrounding the steel sector. Analysts are expecting a prolonged path to recovery for the industry due to lack of supply growth, cost inflation, and shrinking demand. Despite the overall uncertainty, some investors are still confident in United States Steel Co’s ability to weather the storm with its focus on cost-cutting measures and technology investments. Live Quote…
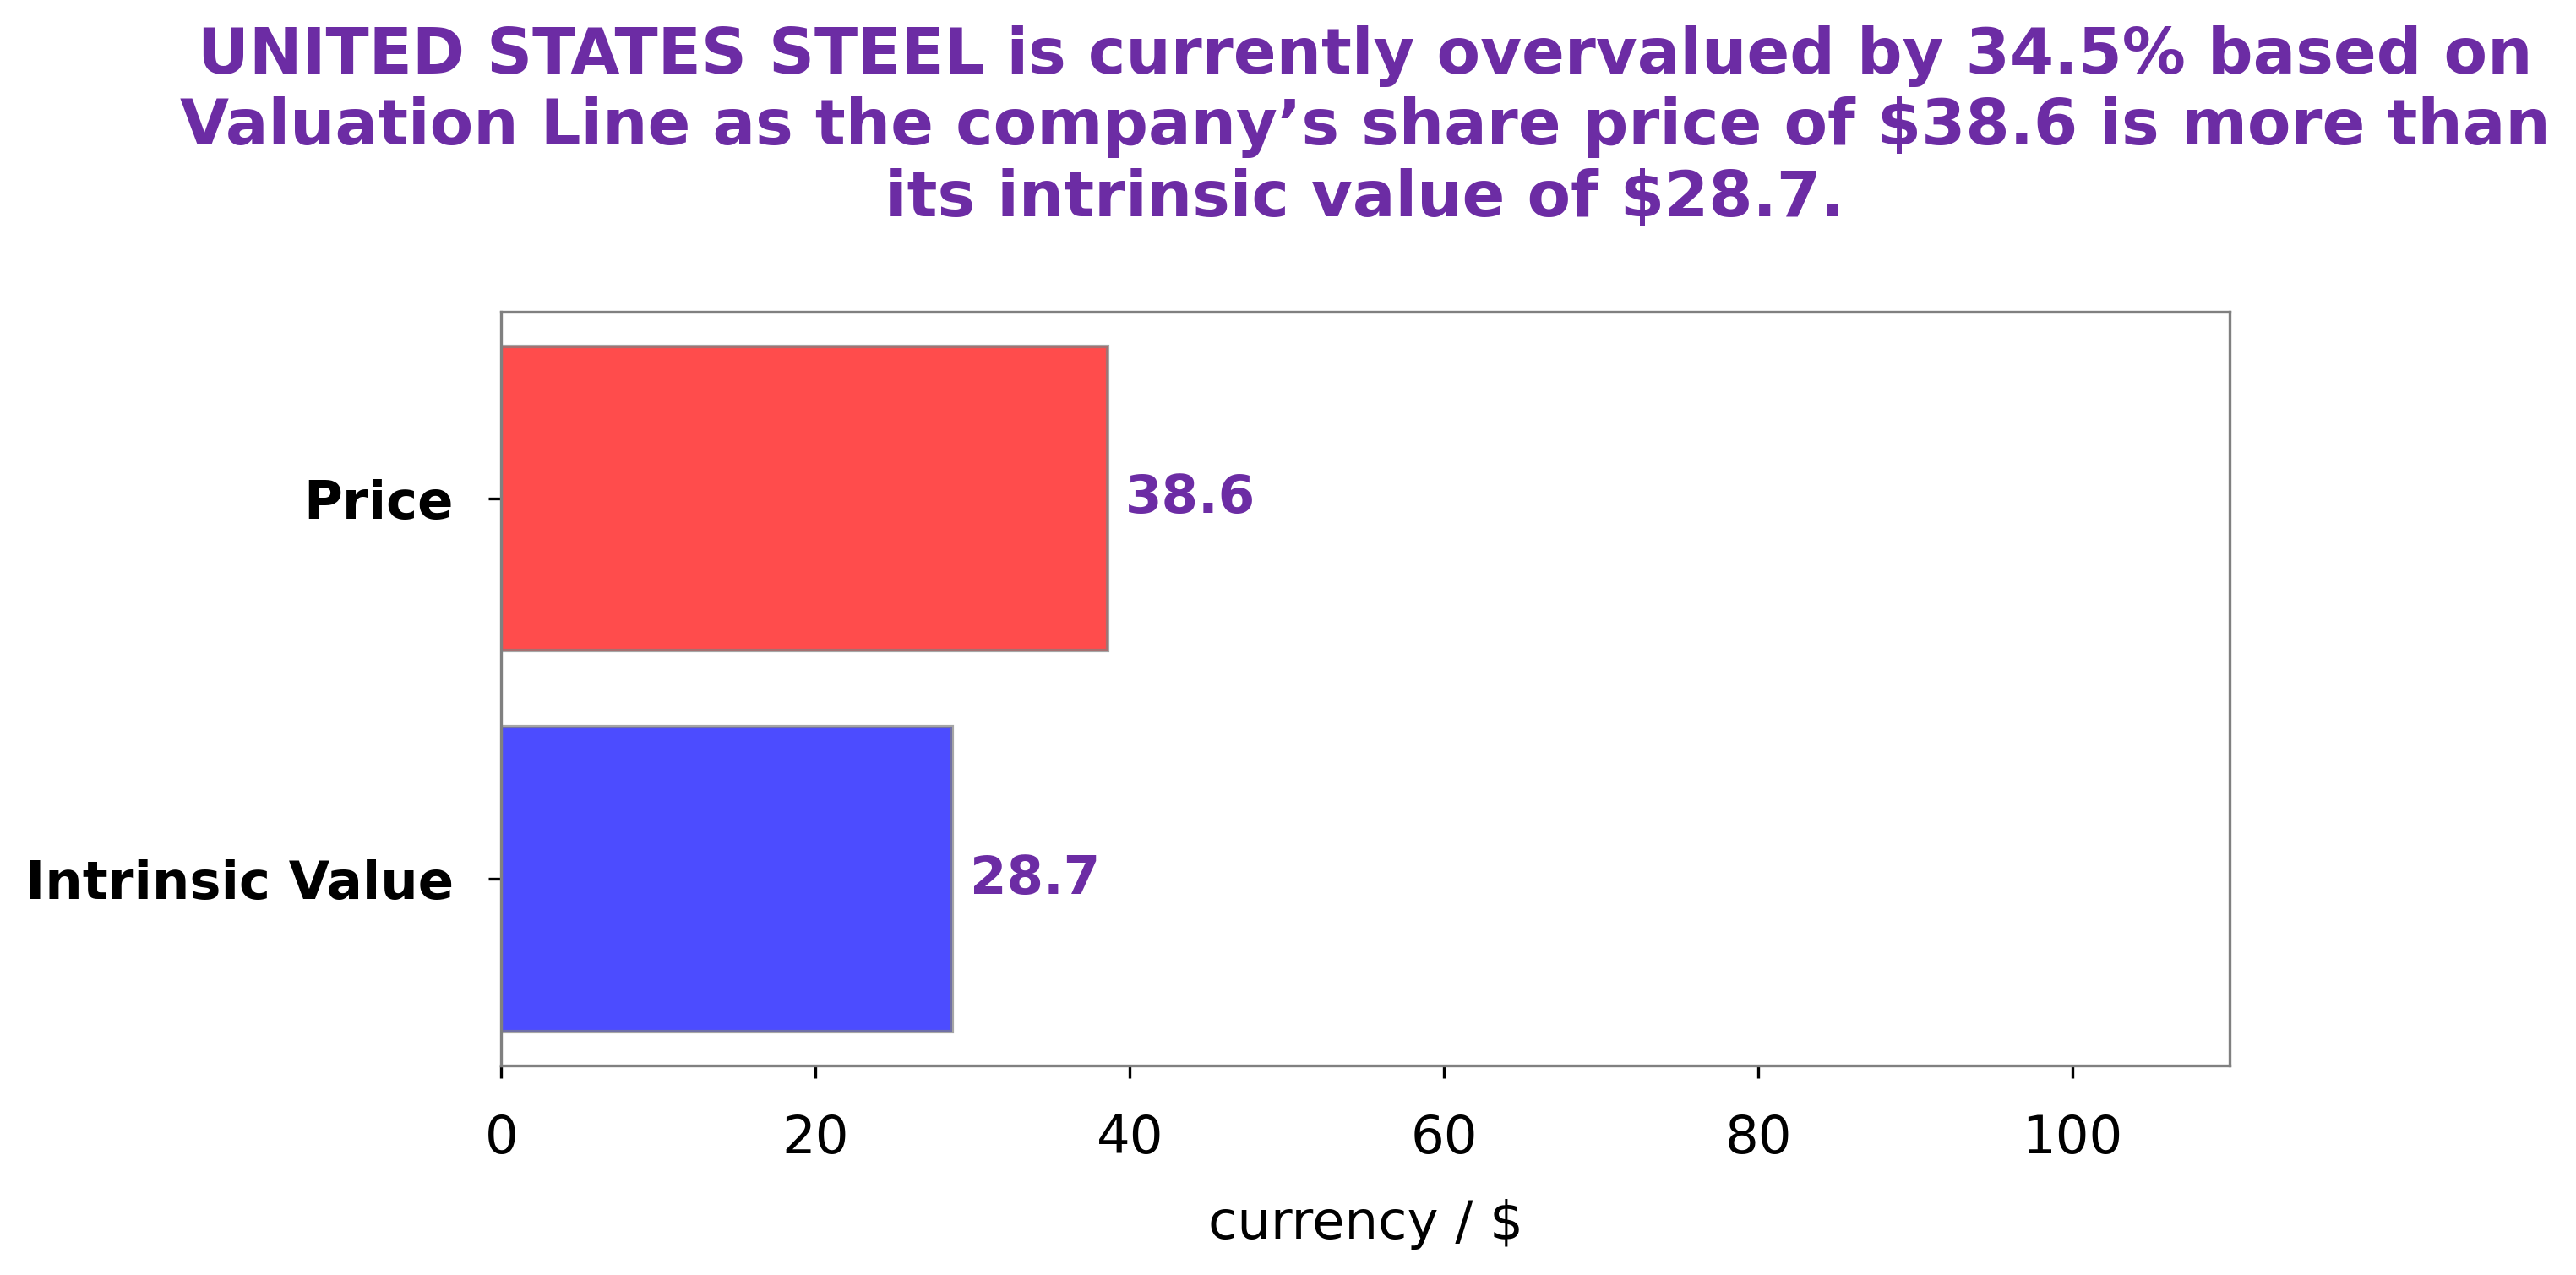
Analysis – X Intrinsic Value Calculation
At GoodWhale, we have conducted an extensive analysis of UNITED STATES STEEL’s fundamentals. Our proprietary Valuation Line has calculated a fair value of the UNITED STATES STEEL stock at around $28.0. However, the current trading price of the stock is only at $24.2, which is a fair price undervalued by 13.4%. This offers an attractive investment opportunity for those interested in investing in UNITED STATES STEEL. More…
Peers
United States Steel Corp, Cleveland-Cliffs Inc, Algoma Steel Group Inc, and Ternium SA are all steel companies that compete for market share. While U.S. Steel is the largest of the four, the other three are not far behind in terms of size and operations. All four companies have a long history in the steel industry and are well-positioned to compete for business in the coming years.
– Cleveland-Cliffs Inc ($NYSE:CLF)
Cleveland-Cliffs Inc is an American mining and natural resources company. The company is the largest producer of iron ore pellets in North America, and a major supplier of direct-reduced iron (DRI) globally. The company also produces other iron-related products, such as metallurgical coal and ferroalloys. It has operations in the United States, Canada, Brazil, and Australia.
Cleveland-Cliffs Inc has a market cap of 8.45B as of 2022. The company’s return on equity is 46.25%. Cleveland-Cliffs Inc is the largest producer of iron ore pellets in North America and a major supplier of direct-reduced iron globally. The company also produces other iron-related products, such as metallurgical coal and ferroalloys.
– Algoma Steel Group Inc ($TSX:ASTL)
Algoma Steel Group Inc is a Canadian steel company located in Sault Ste. Marie, Ontario. The company has a market cap of 1B as of 2022 and a return on equity of 57.58%. The company produces steel products for the construction, energy, manufacturing, and transportation industries.
– Ternium SA ($NYSE:TX)
Ternium SA is a leading steel producer in Latin America with operations in Mexico, Argentina, Chile, Colombia, Guatemala and the United States. The company has a market cap of 5.66B as of 2022 and a Return on Equity of 30.03%. Ternium is the largest integrated steel producer in Latin America and the third largest in the world, with a production capacity of approximately 21 million tons of crude steel per year. The company produces a wide range of steel products, including flat and long products, coated products, and specialty steels. Ternium’s products are used in a variety of industries, such as construction, automotive, appliances, packaging, and others.
Summary
Investors should closely monitor the latest Q3 2023 earnings estimates for United States Steel Co. (NYSE: X) as key analysts at KeyCorp have recently dropped their estimates for the company. This could signal a potential downside risk which investors should take into account when making their investment decisions. Investors should also stay current with all available financial reports, press releases, and news, which could provide valuable insight into the company’s performance.
Fundamental analysis should also be conducted to ensure that the company’s financials are in line with expectations. Finally, investors should factor in market sentiments and macro-economic factors when assessing the upside potential of United States Steel Co. stock.


