Toll Brothers Intrinsic Stock Value – Toll Brothers Reports Record-Breaking EPS and Revenue Figures
December 7, 2023

🌥️Trending News
Toll Brothers ($NYSE:TOL), Inc. is a leading homebuilder in the United States. On Tuesday, the company reported record-breaking earnings per share (EPS) and revenue figures. According to their quarterly report, Toll Brothers reported a GAAP EPS of $4.11, which exceeded the expected amount by $0.37, and a revenue of $3.02B, which surpassed the forecast by $230M. These results show that the company continues to perform strongly despite market conditions. This is not the first time Toll Brothers has achieved record-breaking results.
Over the past few years, it has consistently beaten market expectations and achieved impressive growth. The company attributes its success to its focus on customer satisfaction and its commitment to providing quality homes for its buyers. The strong results bode well for Toll Brothers shareholders. With the company now well-positioned to capitalize on the current market opportunities, investors should expect further growth in the near future.
Earnings
Toll Brothers has recently reported record-breaking earnings per share (EPS) and revenue figures in its latest earning report of FY2023 Q3 as of July 31 2021. According to the report, the company earned a total revenue of 2255.48 million USD, and recorded a net income of 234.93 million USD. Although this amount is a 9.6% decrease from the total revenue in the previous year, the net income decreased by 14.1%. Despite the decrease in both total revenue and net income, Toll Brothers has seen a significant growth over the last three years, as total revenue has grown from 2255.48 million USD to 2687.64 million USD.
About the Company
Income Snapshot
Below shows the total revenue, net income and net margin for Toll Brothers. More…
| Total Revenues | Net Income | Net Margin |
| 9.99k | 1.37k | 13.7% |
Cash Flow Snapshot
Below shows the cash from operations, investing and financing for Toll Brothers. More…
| Operations | Investing | Financing |
| 1.91k | -153.18 | -1.12k |
Balance Sheet Snapshot
Below shows the total assets, liabilities and book value per share for Toll Brothers. More…
| Total Assets | Total Liabilities | Book Value Per Share |
| 12.53k | 5.71k | 63.24 |
Key Ratios Snapshot
Some of the financial key ratios for Toll Brothers are shown below. More…
| 3Y Rev Growth | 3Y Operating Profit Growth | Operating Margin |
| 12.2% | 46.3% | 17.3% |
| FCF Margin | ROE | ROA |
| 18.4% | 16.0% | 8.6% |
Share Price
On Tuesday, TOLL BROTHERS reported record-breaking earnings per share (EPS) and revenue figures. The company’s stock opened at $87.0 and closed at $87.2 on the day of the announcement. These strong financial results demonstrate the company’s commitment to delivering exceptional value to shareholders. Live Quote…
Analysis – Toll Brothers Intrinsic Stock Value
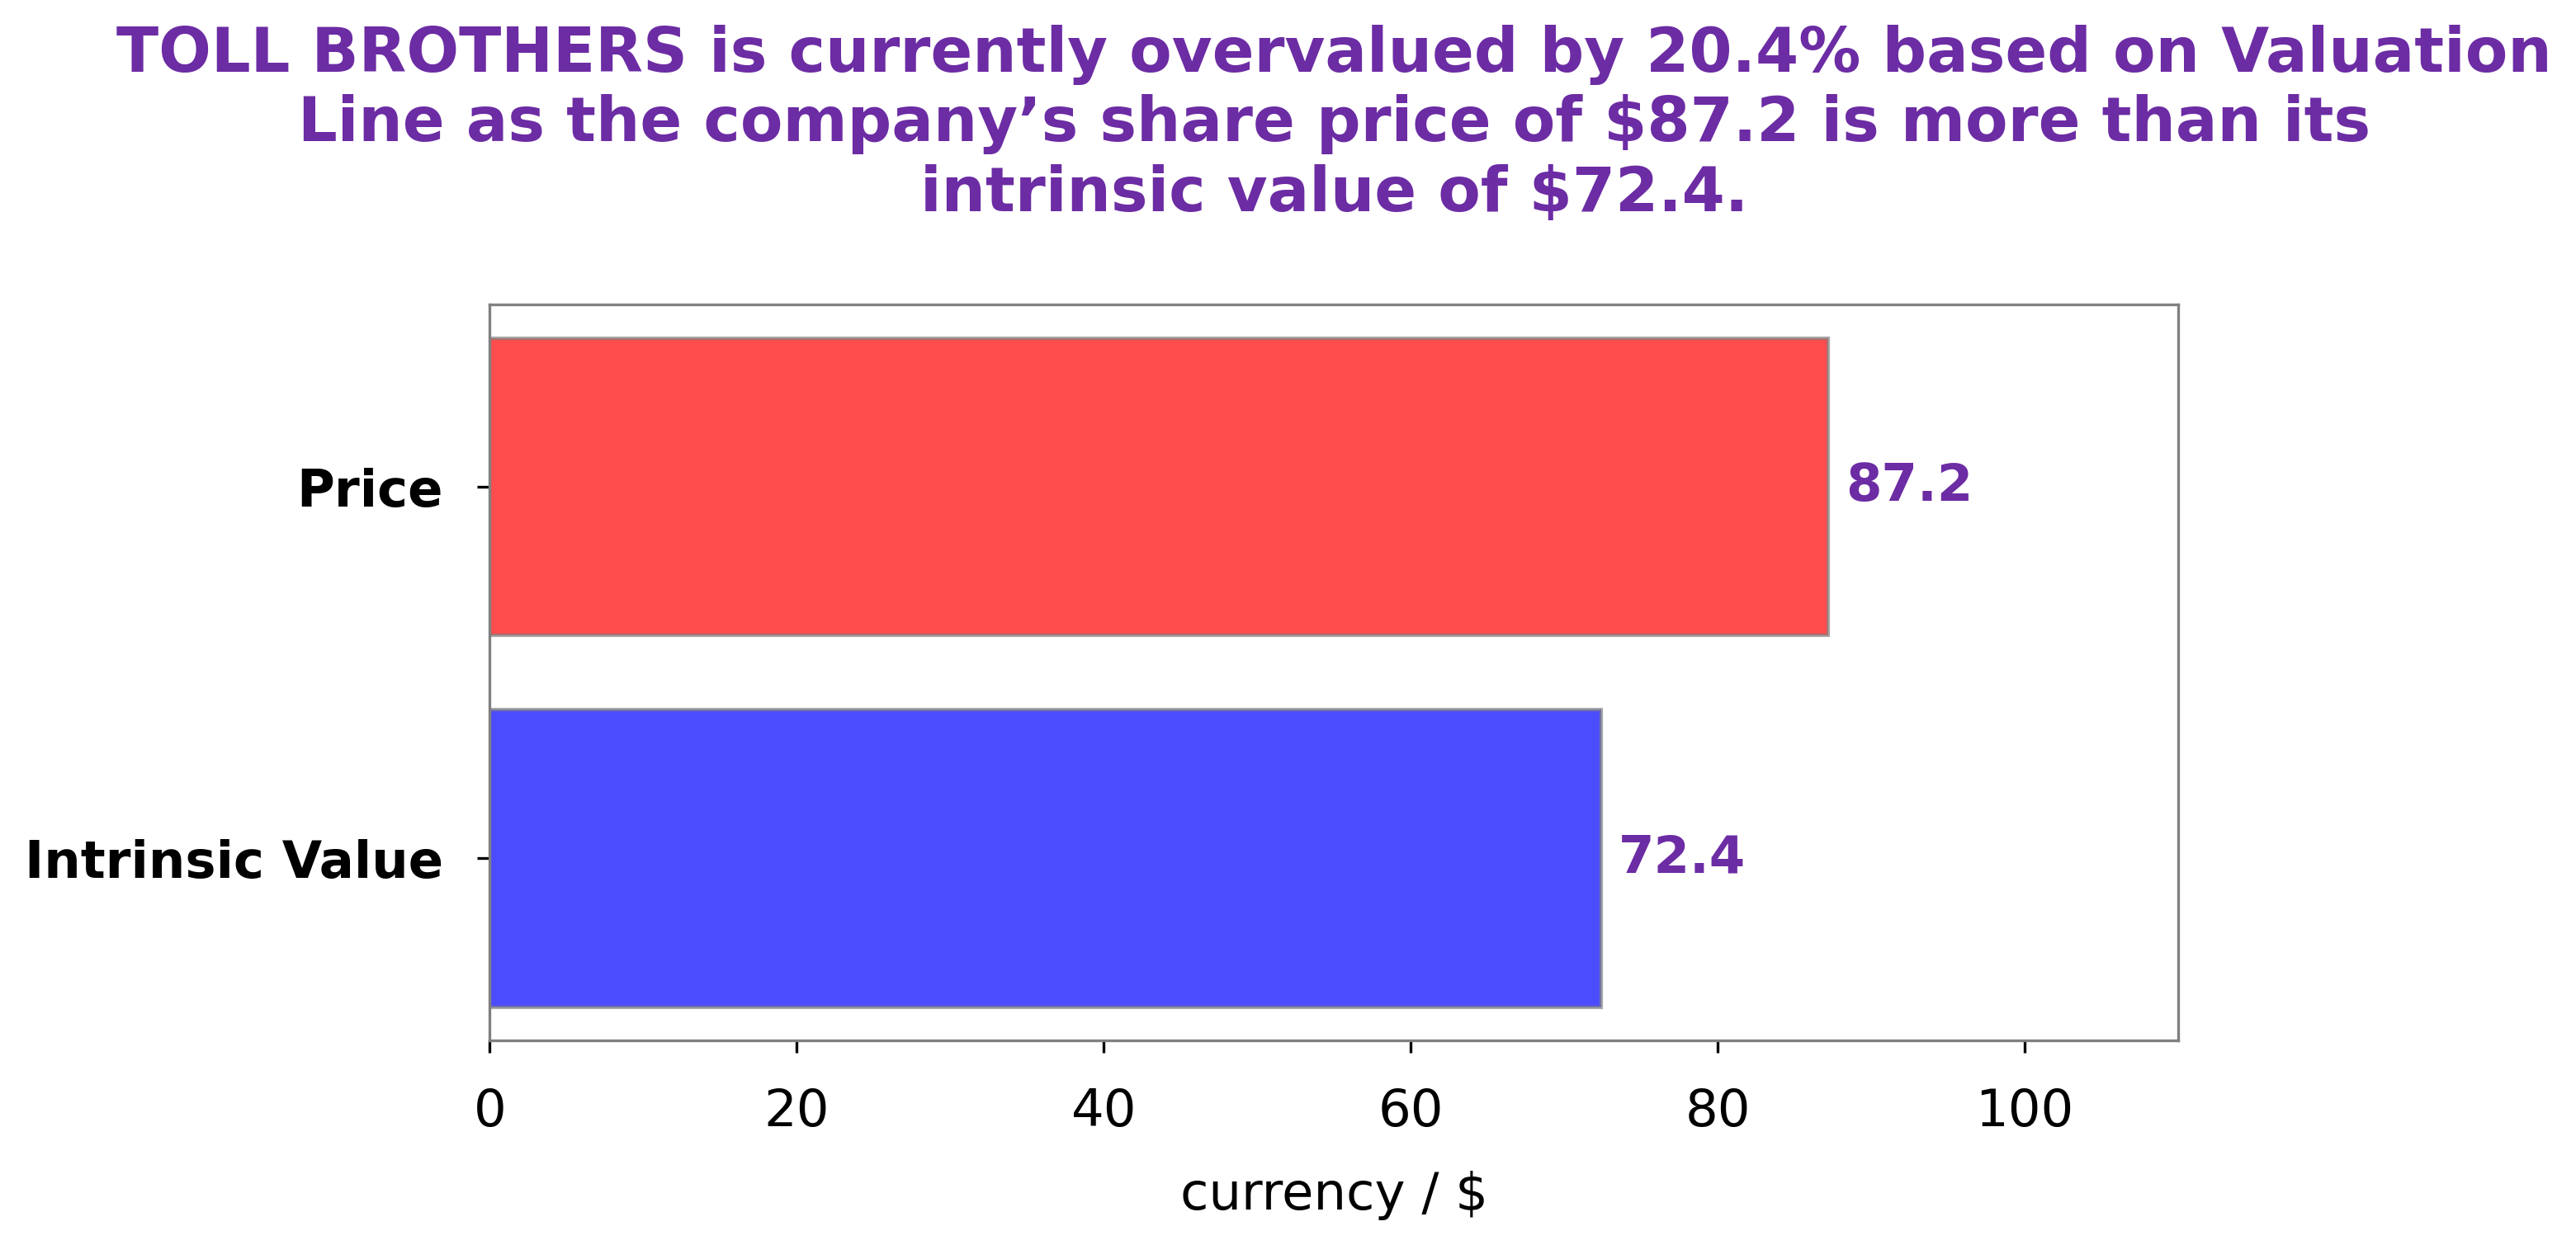
At GoodWhale, we recently conducted an analysis of TOLL BROTHERS’s financials. After considering key data points such as the company’s profitability, growth, and risk profile, our proprietary Valuation Line determined that the fair value of a TOLL BROTHERS share is around $72.1. Currently, TOLL BROTHERS’s stock is trading at $87.2, which is 21.0% overvalued. More…
Peers
The company is headquartered in Horsham, Pennsylvania, and operates in 22 states. The company’s product offerings include single-family detached homes, attached homes, and condominiums. The company’s competitors include D.R. Horton Inc, Redbubble Ltd, and PulteGroup Inc.
– D.R. Horton Inc ($NYSE:DHI)
D.R. Horton Inc is a homebuilding company that was founded in 1978 and is headquartered in Fort Worth, Texas. As of 2022, the company had a market capitalization of 28.86 billion and a return on equity of 25.26%. The company operates in 26 states and 84 markets across the United States. D.R. Horton is the largest homebuilder in the United States by volume, with a market share of approximately 18%. The company builds single-family detached homes, townhomes, and condominiums.
– Redbubble Ltd ($ASX:RBL)
Redbubble Ltd has a market cap of 168.95M as of 2022 and a Return on Equity of -12.32%. The company is an online marketplace that allows artists to sell their artwork on a variety of products.
– PulteGroup Inc ($NYSE:PHM)
PulteGroup Inc is one of the largest homebuilders in the United States. The company has a market cap of 9.97 billion as of 2022 and a return on equity of 24.61%. The company builds and sells single-family homes, townhouses, condominiums, and apartments in the United States.
Summary
Toll Brothers, Inc., a luxury homebuilder, recently reported a strong financial performance in their second quarter of 2021. The company’s GAAP earnings per share (EPS) came in above expectations at $4.11, beating the consensus estimate by $0.37. Revenue was also higher than expected at $3.02 billion, beating the estimate by $230 million. This performance demonstrates that the company is continuing to benefit from the increased demand for new homes that has resulted from the ongoing pandemic.
Moreover, Toll Brothers has continued to successfully acquire land and manage its existing construction pipeline, allowing it to capitalize on the elevated demand. Investors should continue to monitor the company’s financials to assess if it can continue its current growth trajectory.


