Spectrum Brands Intrinsic Value Calculation – Spectrum Brands Holdings Sees Revenue Dip in Q4 2023
November 21, 2023

🌥️Trending News
Spectrum Brands ($NYSE:SPB) Holdings Inc. saw a decrease in its revenue for the fourth quarter of 2023. Spectrum Brands Holdings is a leading home and commercial products company that produces a variety of consumer goods. With a portfolio of more than 50 leading brands, some of which are household names in America, the company operates in two main segments: Global Batteries and Appliances and Global Pet Supplies and Home and Garden. In the recent quarter, the company experienced a decline in sales from both segments.
The company is focused on increasing sales and maintaining profitability through strategic investments, cost-cutting measures, and new product development. With a strong balance sheet and an experienced management team, Spectrum Brands Holdings is well-positioned to weather the current market downturn and emerge stronger than ever.
Earnings
In its latest earnings report for the fourth quarter of Fiscal Year 2023, ending September 30 2021, SPECTRUM BRANDS reported total revenue of 757.8 million USD and net income of 50.2 million USD. This marks an increase in total revenue of 1.1% compared to the previous year, and a massive 239.2% increase in net income. Further analysis shows that SPECTRUM BRANDS has seen a dip in total revenue over the past three years, from 757.8 million USD in 2021 to 740.7 million USD this year. Despite this decrease, the company has managed to increase its net income significantly, showing a canny ability to manage costs while maintaining profitability.
About the Company
Income Snapshot
Below shows the total revenue, net income and net margin for Spectrum Brands. More…
| Total Revenues | Net Income | Net Margin |
| 2.92k | 1.8k | -1.9% |
Cash Flow Snapshot
Below shows the cash from operations, investing and financing for Spectrum Brands. More…
| Operations | Investing | Financing |
| -409.7 | 3.18k | -2.26k |
Balance Sheet Snapshot
Below shows the total assets, liabilities and book value per share for Spectrum Brands. More…
| Total Assets | Total Liabilities | Book Value Per Share |
| 5.26k | 2.74k | 70.57 |
Key Ratios Snapshot
Some of the financial key ratios for Spectrum Brands are shown below. More…
| 3Y Rev Growth | 3Y Operating Profit Growth | Operating Margin |
| -9.7% | -59.6% | -5.6% |
| FCF Margin | ROE | ROA |
| -16.1% | -4.0% | -1.9% |
Share Price
On Monday, SPECTRUM BRANDS, the leading global branded consumer products company, reported a revenue dip for the fourth quarter of 2023. This caused their stock to open at $67.4 and close at $66.1, a decrease of 2.5% from their previous closing price of 67.8. The company attributed its revenue decline to lower sales in its Global Pet Supplies and Home & Garden businesses in North America, primarily due to reduced demand due to the global pandemic. Live Quote…
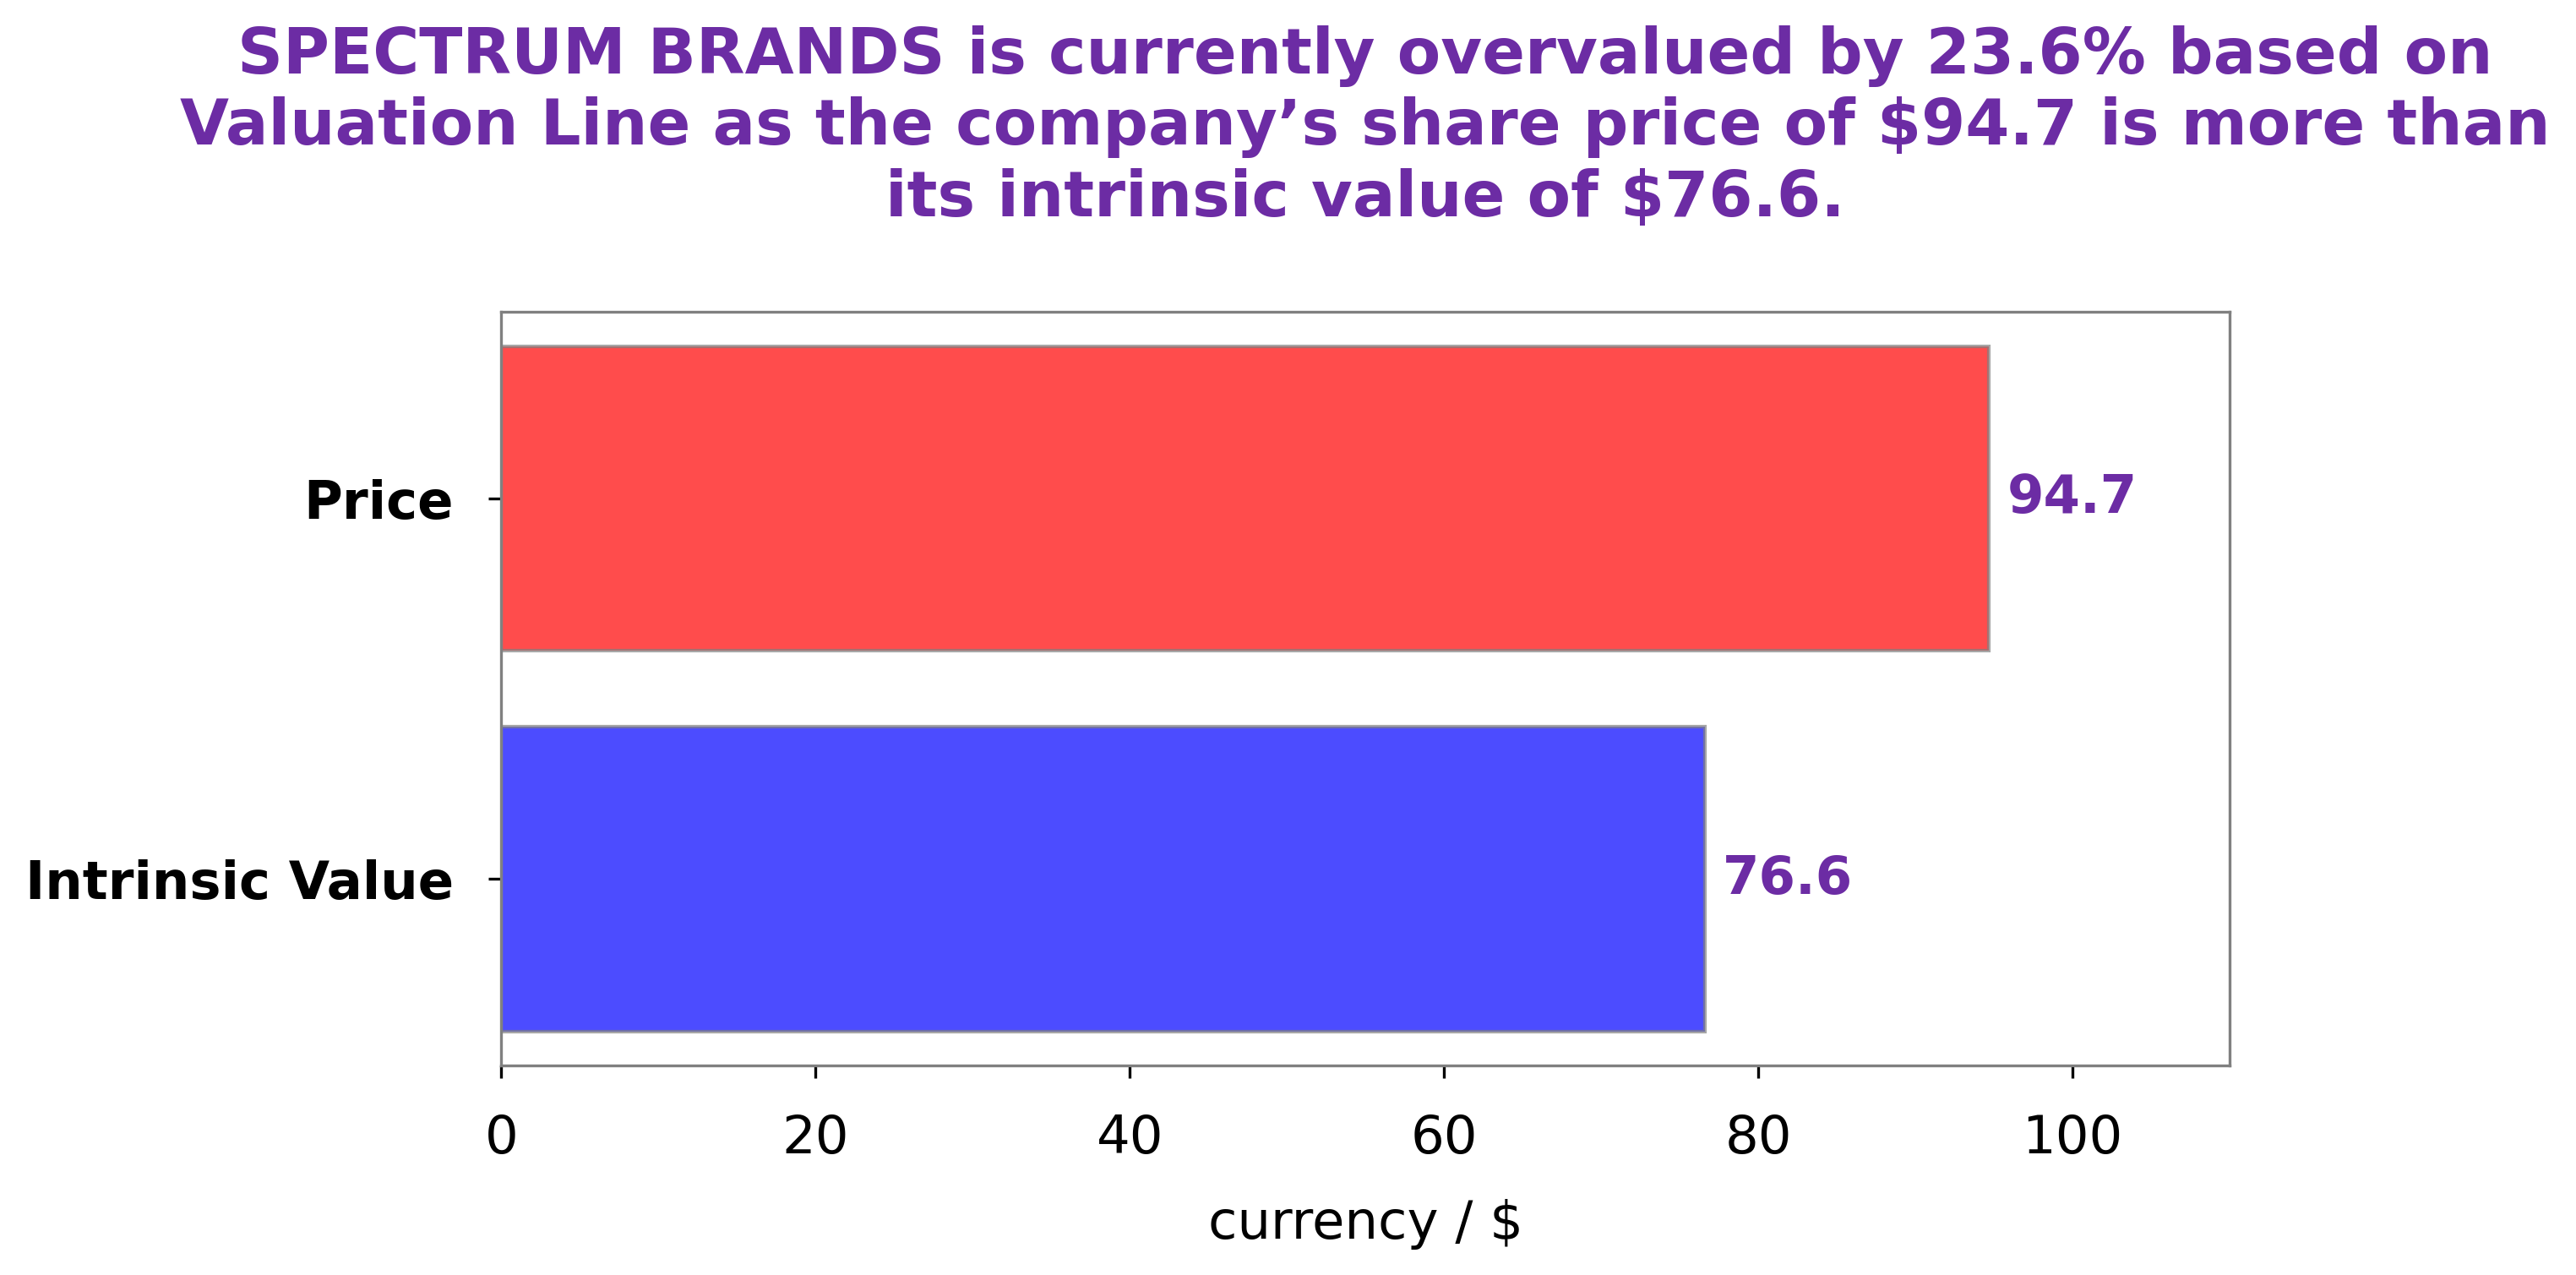
Analysis – Spectrum Brands Intrinsic Value Calculation
As GoodWhale, we have conducted an analysis of SPECTRUM BRANDS‘s wellbeing. After analyzing the data, our proprietary Valuation Line has determined that the fair value of SPECTRUM BRANDS’ share is around $57.3. More…
Peers
Despite the intense competition, Spectrum Brands Holdings Inc has been able to remain a top player in the industry by focusing on innovation, customer service, and providing high-quality products at competitive prices.
– Godrej Consumer Products Ltd ($BSE:532424)
Godrej Consumer Products Ltd is a leading Indian fast-moving consumer goods company, headquartered in Mumbai. It manufactures and markets a wide range of products across food, personal care, and home care segments. The company has a market cap of 937.97B as of 2023, which is indicative of its strong performance in the market. Its Return on Equity (ROE), which is an indicator of how effectively the company uses its shareholders’ equity to generate profits, is 10.44%. This high ROE reflects the company’s ability to generate profits for its shareholders.
– Ontex Group NV ($OTCPK:ONXYY)
Ontex Group NV is a leading global hygiene company with over 20 years of experience in the hygiene and personal care market. It is headquartered in Belgium and serves markets in Europe, Africa, Latin America, the Middle East, and Asia Pacific. The company’s market cap as of 2023 stands at 593.34M, indicating a strong financial standing in the market. Its Return on Equity (ROE) is -7.25%, which is a measure of how efficient the company utilizes its assets to generate profits. Ontex Group NV is engaged in the production, distribution and marketing of products such as baby diapers, adult incontinence products, feminine care products, and wet wipes.
– Henkel AG & Co KGaA ($OTCPK:HENOY)
Henkel AG & Co KGaA is a multinational consumer goods company based in Düsseldorf, Germany. It specializes in the production of laundry detergents, beauty care products, and adhesives, among other products. As of 2023, the company’s market capitalization was 28.76 billion euros. This figure reflects the company’s success in increasing shareholder value over the past year. Henkel’s return on equity (ROE) was 4.84%, which indicates that the company is efficiently utilizing its assets to generate a return. Henkel’s strong financial performance is testament to its business model and commitment to innovation.
Summary
Investors may be optimistic that the company can recover losses through its diversified portfolio and focus on cost-cutting initiatives. Furthermore, Spectrum’s strong balance sheet with no debt and its portfolio of leading brands provides investors with the potential for long-term growth. Investors should monitor the company’s performance and be mindful of macroeconomic factors that may affect its business.


