TD SYNNEX Reports USD 13960.6 Million Revenue for FY2023 Q3, Down 9.1% YOY
September 28, 2023

🌥️Earnings Overview
On September 26 2023, TD SYNNEX ($NYSE:SNX) reported their financial results for the third quarter of FY2023 (ending August 31 2023), which showed a year-over-year decrease in total revenue of 9.1%, to USD 13960.6 million, and a 6.4% decrease in net income to USD 139.3 million.
Analysis
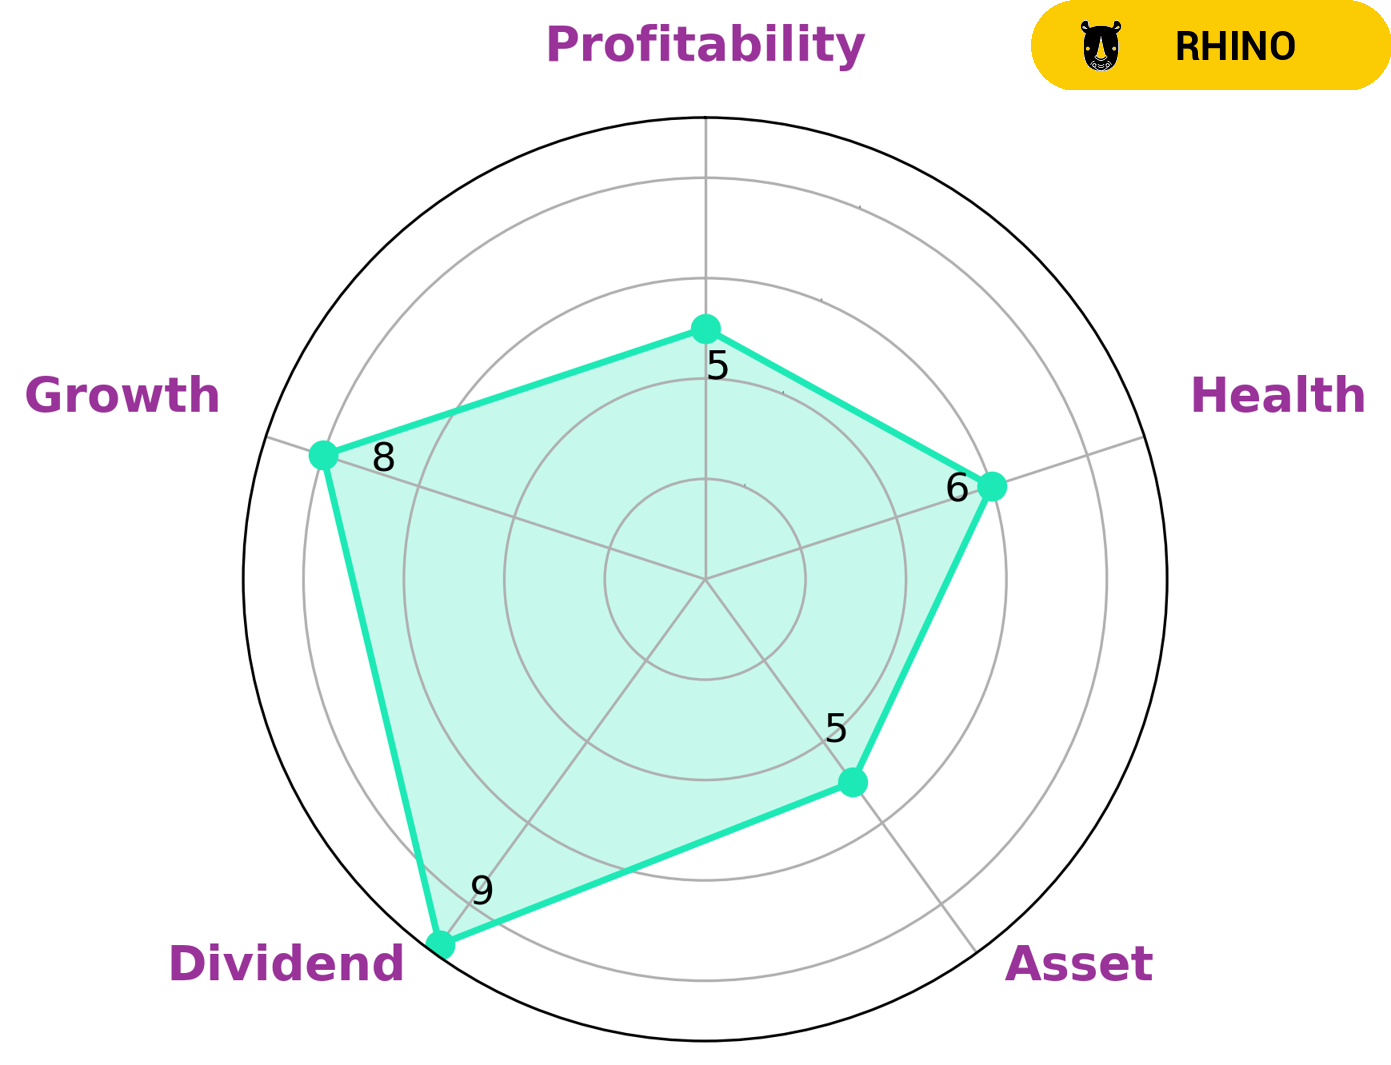
GoodWhale has conducted an analysis of TD SYNNEX‘s fundamentals and concluded that the company has been classified as a ‘cheetah’ due to its high revenue or earnings growth but more unstable profitability. Such companies may be of interest to investors who are looking for dividend, growth, or assets and have a medium risk tolerance for profitability. Given TD SYNNEX’s intermediate health score of 6/10 considering its cashflows and debt, we conclude that the company is likely to be able to pay off its debt and fund its future operations. TD SYNNEX has a strong presence in the dividend, growth, and asset markets, while its profitability remains medium. Therefore, investors considering this company should consider their risk tolerance before investing. More…
About the Company
Income Snapshot
Below shows the total revenue, net income and net margin for Td Synnex. More…
| Total Revenues | Net Income | Net Margin |
| 59.4k | 658.91 | 1.4% |
Cash Flow Snapshot
Below shows the cash from operations, investing and financing for Td Synnex. More…
| Operations | Investing | Financing |
| 839.63 | -115.51 | -275.59 |
Balance Sheet Snapshot
Below shows the total assets, liabilities and book value per share for Td Synnex. More…
| Total Assets | Total Liabilities | Book Value Per Share |
| 28.5k | 20.14k | 89.25 |
Key Ratios Snapshot
Some of the financial key ratios for Td Synnex are shown below. More…
| 3Y Rev Growth | 3Y Operating Profit Growth | Operating Margin |
| 35.6% | 19.7% | 1.9% |
| FCF Margin | ROE | ROA |
| 1.2% | 8.5% | 2.5% |
Peers
It has a strong presence in the market with a wide range of products and services. The company has a good reputation and is known for its quality products and services.
However, it faces stiff competition from its competitors such as VNET Group Inc, DC Two Ltd, Searchlight Solutions Ltd.
– VNET Group Inc ($NASDAQ:VNET)
VNET Group Inc is a global provider of cloud-based communications and collaboration solutions. The company has a market cap of 760.84M as of 2022 and a return on equity of 2.37%. The company’s products and services include VoIP, video conferencing, cloud PBX, and unified communications. VNET Group Inc is headquartered in Toronto, Canada.
– DC Two Ltd ($ASX:DC2)
D2C Two Ltd is a publicly traded company with a market capitalization of 3.56 million as of 2022. The company has a negative return on equity of 73.27%. D2C Two Ltd is engaged in the business of providing online marketing and advertising services.
Summary
TD SYNNEX reported a 9.1% decrease in total revenue and 6.4% decrease in net income for the third quarter of FY2023 ending August 31 2023. This caused the stock price to drop on the same day. For investors, the decrease in earnings is a worrying sign, and suggests that the company is not performing as well as expected. Further analysis is needed to determine if the current downward trend is likely to continue or if the company will be able to recover. It is important to assess the factors that may have contributed to the decrease in earnings, such as changes in competition, consumer demand, and economic conditions.
Additionally, investors should consider the company’s future prospects and compare it with other companies in the same industry. With careful analysis, investors can make a better decision on whether or not TD SYNNEX is a good investment in the long term.
Related Posts


Recent Posts


