T-MOBILE US Reports 2.6% Decrease in Total Revenue for Q2 FY2023
August 2, 2023

🌥️Earnings Overview
T-MOBILE US ($NASDAQ:TMUS) reported a revenue of USD 19196.0 million for the second quarter of FY2023, a decrease of 2.6% year-on-year from the same period in 2023. Net income for the quarter was USD 2221.0 million, compared to a loss of USD 108.0 million in the same quarter of the previous year. The results were reported on June 30, 2023.
Analysis
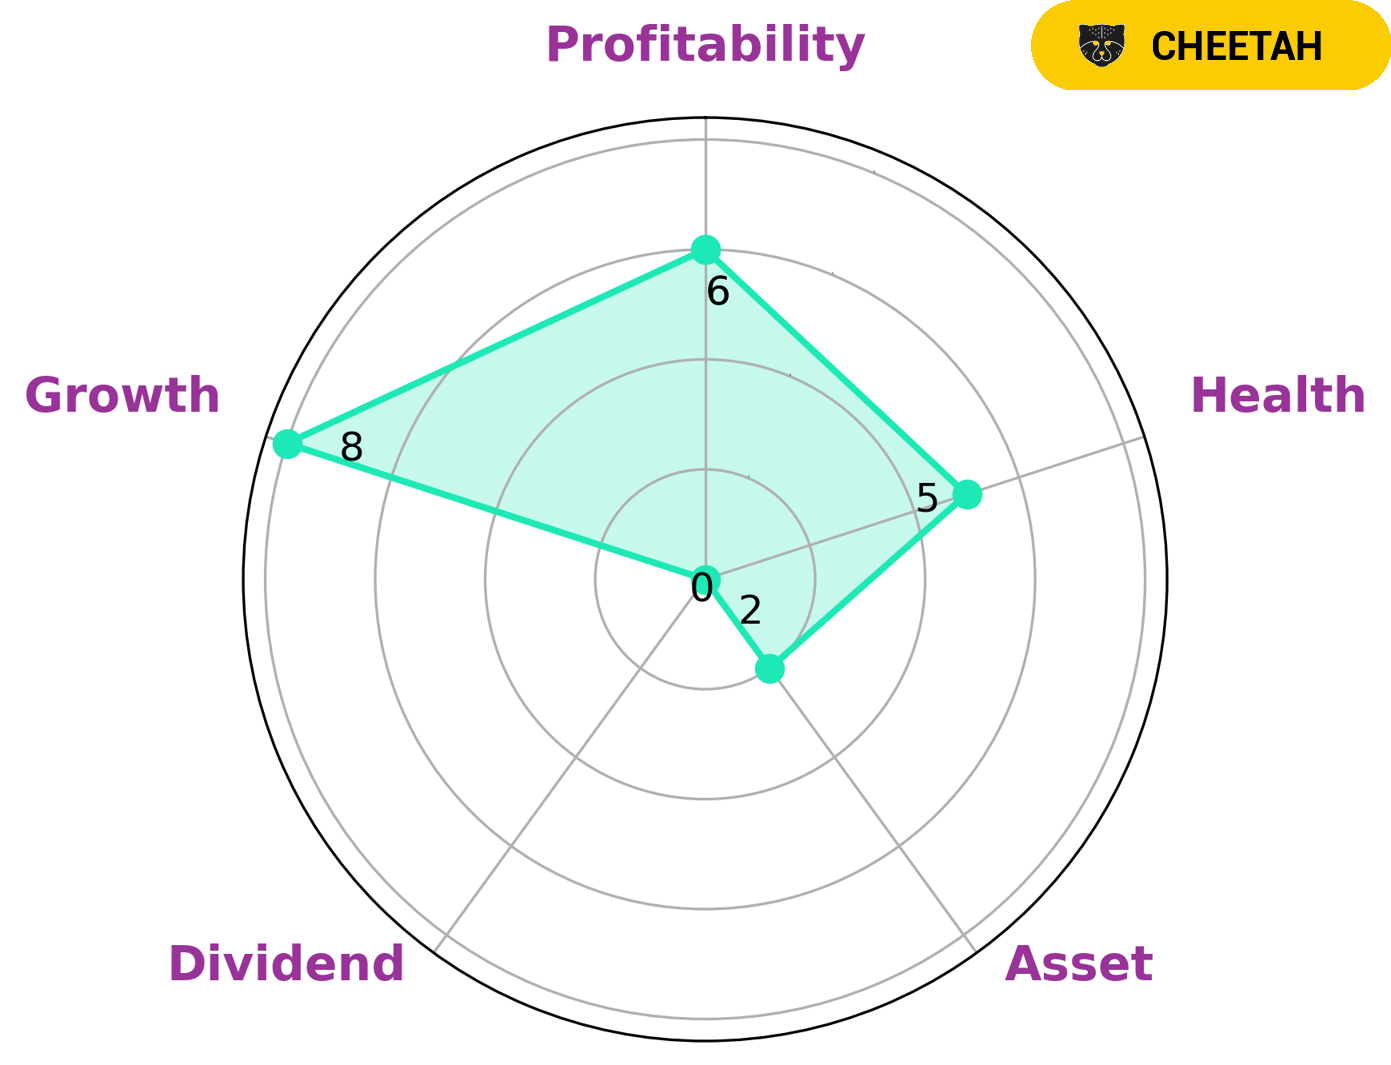
GoodWhale has analyzed T-MOBILE US‘s fundamentals and classified it as a ‘cheetah’ based on its Star Chart. This type of company has achieved high revenue or earnings growth, but is considered less stable due to lower profitability. Investors interested in this type of company are typically those who have a higher risk tolerance and seek out potential for higher returns in the short term. T-MOBILE US has an intermediate health score of 4/10, which indicates that it is likely to pay off debt and fund future operations in a timely manner. It is strong in growth, medium in profitability, and weak in asset and dividend. This indicates that investors should carefully analyze the company’s financial statements in order to make sure it is able to generate enough cash flow to cover the costs associated with paying off debts and other operational expenses. More…
About the Company
Income Snapshot
Below shows the total revenue, net income and net margin for T-mobile Us. More…
| Total Revenues | Net Income | Net Margin |
| 78.58k | 6.15k | 8.9% |
Cash Flow Snapshot
Below shows the cash from operations, investing and financing for T-mobile Us. More…
| Operations | Investing | Financing |
| 17.13k | -7.92k | -5.63k |
Balance Sheet Snapshot
Below shows the total assets, liabilities and book value per share for T-mobile Us. More…
| Total Assets | Total Liabilities | Book Value Per Share |
| 210.6k | 144.85k | 55.7 |
Key Ratios Snapshot
Some of the financial key ratios for T-mobile Us are shown below. More…
| 3Y Rev Growth | 3Y Operating Profit Growth | Operating Margin |
| 15.0% | 30.8% | 14.3% |
| FCF Margin | ROE | ROA |
| 4.9% | 10.6% | 3.3% |
Peers
The competition between T-Mobile US Inc and its competitors is fierce. AT&T Inc, Verizon Communications Inc, and Lumen Technologies Inc are all trying to gain market share in the wireless carrier industry. T-Mobile US Inc has been able to gain some ground on its competitors by offering innovative plans and features that appeal to customers.
– AT&T Inc ($NYSE:T)
AT&T Inc. is an American multinational conglomerate holding company headquartered at Whitacre Tower in Downtown Dallas, Texas. It is the world’s largest telecommunications company, the second largest provider of mobile telephone services, and the largest provider of fixed telephone services in the United States through AT&T Communications. Since June 14, 2018, it is also the parent company of mass media conglomerate WarnerMedia, making it the world’s largest entertainment company in terms of revenue. As of 2019, AT&T is ranked #9 on the Fortune 500 rankings of the largest United States corporations by total revenue.
AT&T Inc. has a market capitalization of $129.91 billion as of 2022 and a return on equity of 17.05%. The company is the world’s largest telecommunications company and the second largest provider of mobile telephone services. AT&T Inc. is also the largest provider of fixed telephone services in the United States through AT&T Communications. The company’s mass media subsidiary, WarnerMedia, makes AT&T the world’s largest entertainment company in terms of revenue.
– Verizon Communications Inc ($NYSE:VZ)
Verizon Communications Inc. is an American multinational telecommunications conglomerate and a corporate component of the Dow Jones Industrial Average. The company has a market cap of 156.95B as of 2022 and a Return on Equity of 20.79%. Verizon is one of the largest telecommunications companies in the world, with operations in the United States, Canada, and Europe. The company offers a variety of services, including voice, data, and video. Verizon also provides a variety of other services, such as directory assistance, high-speed Internet, and long distance calling. In addition, Verizon offers a variety of wireless services, including voice, text, and data.
– Lumen Technologies Inc ($NYSE:LUMN)
Lumen Technologies is a leading provider of data, networking and communications services. The company has a market cap of 7.6 billion as of 2022 and a return on equity of 20.85%. The company’s products and services include data center and cloud services, enterprise networking, and communications and collaboration solutions. Lumen Technologies also provides managed services, professional services and support services. The company serves customers in more than 150 countries.
Summary
Investors may find T-MOBILE US‘s second quarter FY2023 earnings results an attractive investment opportunity. With the company’s strong balance sheet and cash flow, investors may consider investing in T-MOBILE US due to its potential growth in the long run.
Related Posts


Recent Posts


