Sterling Check Intrinsic Stock Value – STERLING CHECK Reports 9.4% Decrease in Revenue for FY2023 Q3
November 20, 2023

🌥️Earnings Overview
On November 8, 2023, STERLING CHECK ($NASDAQ:STER) announced its results for the third quarter of FY2023, revealing total revenues of USD 180.6 million – a decrease of 9.4% on the same period in the previous year. Net income fell drastically by 74.7%, coming to USD 2.4 million as compared to the same period in the previous year.
Analysis – Sterling Check Intrinsic Stock Value
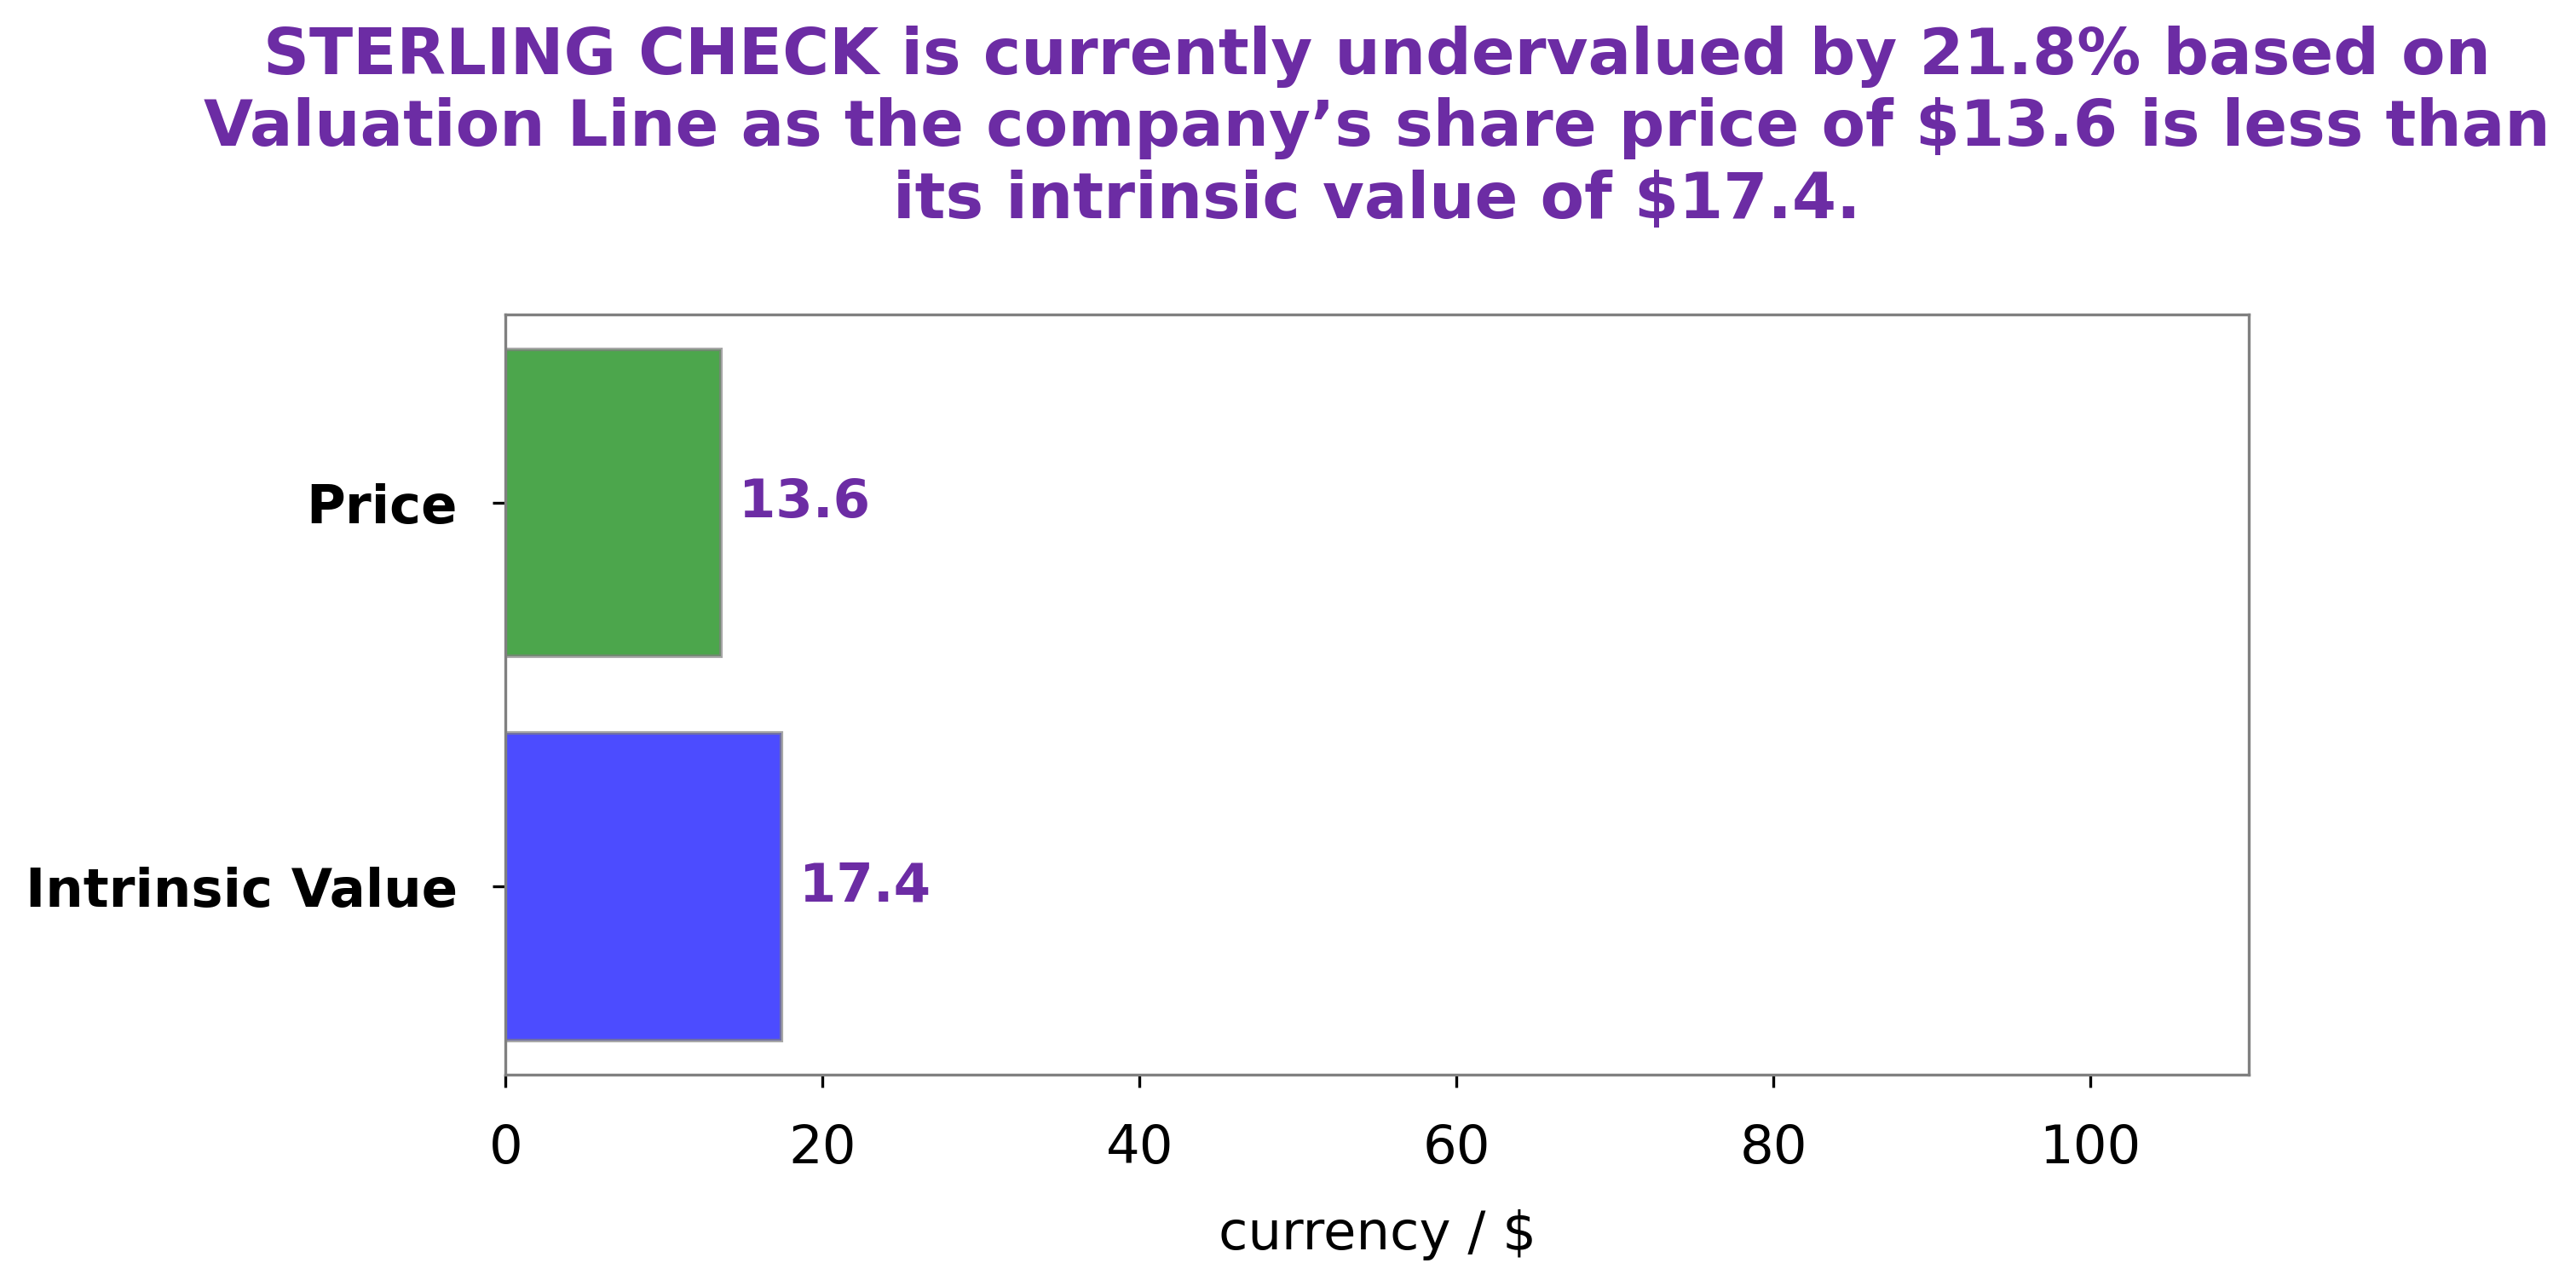
GoodWhale conducted an analysis of STERLING CHECK‘s wellbeing and found that the intrinsic value of STERLING CHECK share was around $17.4, calculated by our proprietary Valuation Line. This means that the current stock price of STERLING CHECK, which is at $11.2, is undervalued by 35.8%. This presents an opportunity for investors to purchase STERLING CHECK stock at a discounted rate. Furthermore, the data gathered from GoodWhale’s analysis indicates that STERLING CHECK is financially sound and therefore a safe investment for those willing to take advantage of the current market conditions. More…
About the Company
Income Snapshot
Below shows the total revenue, net income and net margin for Sterling Check. More…
| Total Revenues | Net Income | Net Margin |
| 720.14 | -4.43 | 0.6% |
Cash Flow Snapshot
Below shows the cash from operations, investing and financing for Sterling Check. More…
| Operations | Investing | Financing |
| 96.34 | -68.29 | -76.5 |
Balance Sheet Snapshot
Below shows the total assets, liabilities and book value per share for Sterling Check. More…
| Total Assets | Total Liabilities | Book Value Per Share |
| 1.39k | 666.17 | 7.58 |
Key Ratios Snapshot
Some of the financial key ratios for Sterling Check are shown below. More…
| 3Y Rev Growth | 3Y Operating Profit Growth | Operating Margin |
| 15.5% | – | 4.4% |
| FCF Margin | ROE | ROA |
| 10.7% | 2.8% | 1.4% |
Peers
The competition among Sterling Check Corp and its competitors is intense. Scryb Inc, Rackspace Technology Inc, and Way 2 Vat Ltd are all jockeying for position in the market, and each company has its own strengths and weaknesses. Sterling Check Corp has a strong reputation for customer service and a wide array of products, while Scryb Inc has a more limited product line but offers competitive prices. Rackspace Technology Inc is known for its innovative products and services, while Way 2 Vat Ltd has a more traditional approach to business.
– Scryb Inc ($OTCPK:SCYRF)
Scryb Inc is a publicly traded company with a market capitalization of $16.73 million as of 2022. The company has a negative return on equity of 105.94%. Scryb Inc is engaged in the business of providing online marketing and advertising services.
– Rackspace Technology Inc ($NASDAQ:RXT)
Rackspace Technology, Inc. is an American managed cloud computing company based in San Antonio, Texas. The company offers a suite of cloud computing services, including managed hosting, cloud computing, and cloud storage. Rackspace was founded in 1998 and went public in 2008. As of 2018, it employed over 4,000 people.
– Way 2 Vat Ltd ($ASX:W2V)
Way 2 Vat Ltd is a company that provides VAT services. It has a market cap of 4.83M as of 2022. The company was founded in 2006 and is headquartered in London, United Kingdom.
Summary
STERLING CHECK reported a 9.4% decline in total revenue for its third quarter of FY2023, which totaled USD 180.6 million. Net income for the quarter dropped 74.7%, resulting in a net income of USD 2.4 million. This has caused concern among investors as the company has not been performing well over the past few quarters.
Long-term investors may want to tread carefully and analyze the company’s financial performance in greater detail before making any investments. Short-term investors may want to avoid the stock until there is a sign of improvement in the company’s financial performance.


