Resmed Inc Intrinsic Value Calculator – RESMED INC Reports 22.7% Increase in Total Revenue for Q4 2023
August 8, 2023

☀️Earnings Overview
On August 3, 2023, RESMED INC ($NYSE:RMD) reported its financial results for the fourth quarter ending June 30, 2023. Total revenue was USD 1122.1 million, representing a 22.7% increase compared to the same period in the previous year. Net income also increased year over year by 17.7% to USD 229.7 million.
Analysis – Resmed Inc Intrinsic Value Calculator
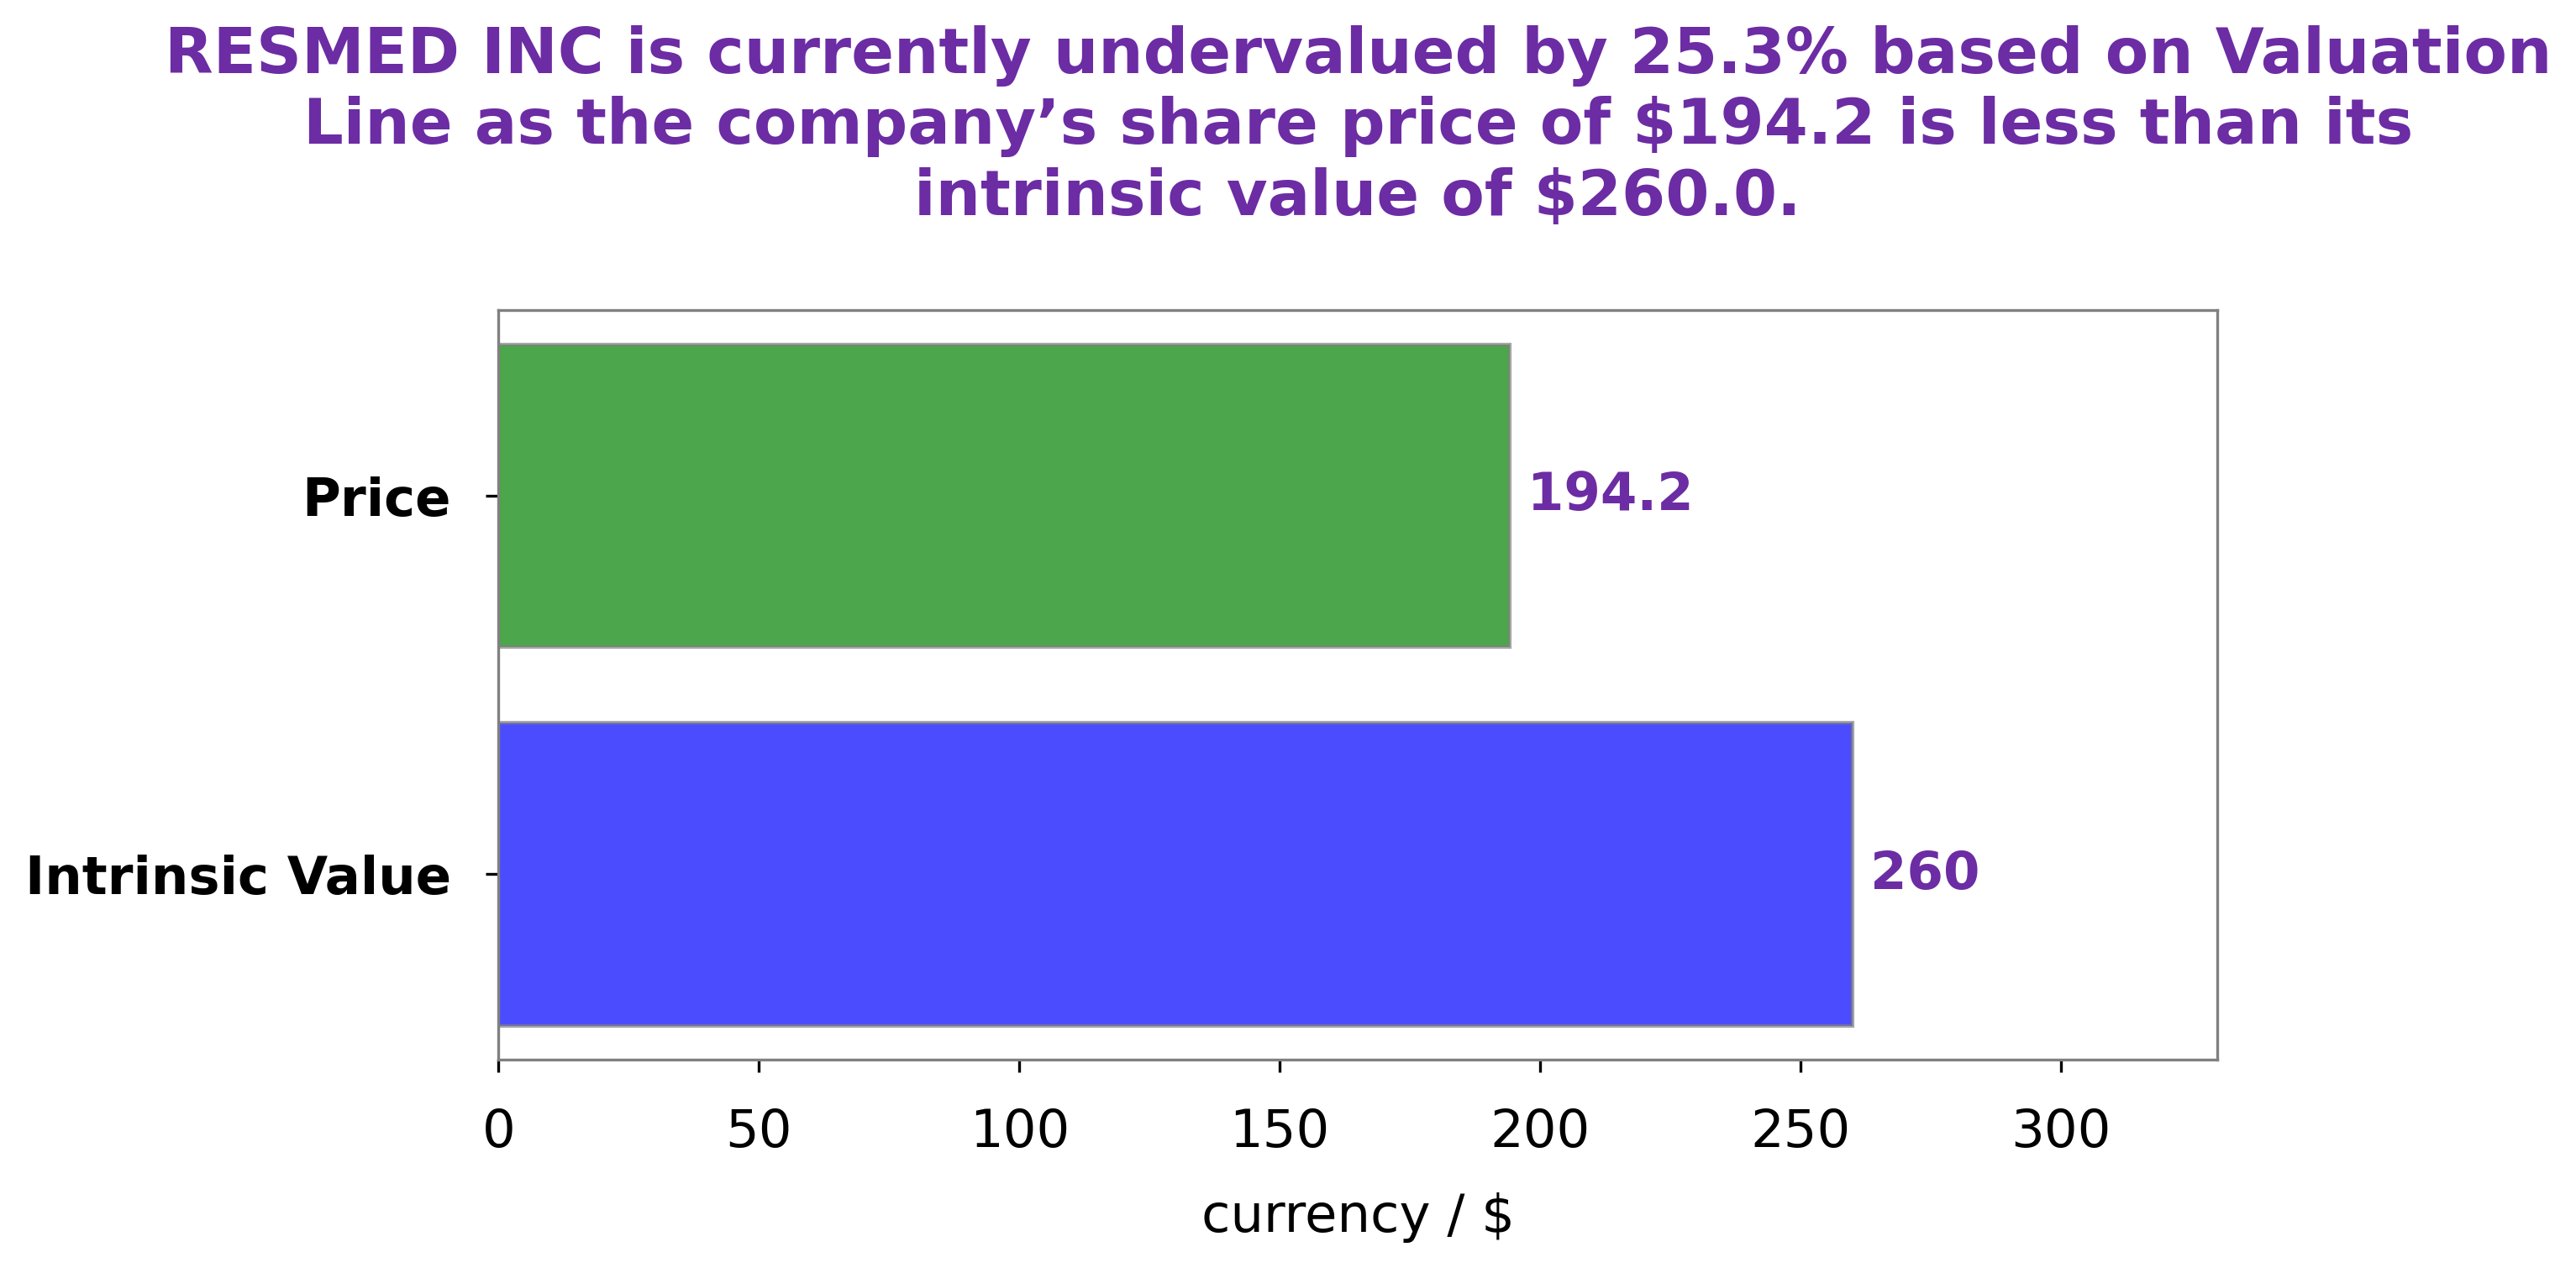
GoodWhale has conducted an analysis of RESMED INC’s financials and determined that the fair value of RESMED INC shares is around $254.4, calculated by our proprietary Valuation Line. Currently, RESMED INC stock is being traded at $220.0 – a fair price but undervalued by 13.5%. This presents a great opportunity to buy RESMED INC stock at a lower price than its actual value. It should be noted that the fair value of any stock is an estimate based on certain assumptions and can vary depending on various factors. Investing in any stock involves a certain degree of risk and investors should do their due diligence before making any investment decision. More…
About the Company
Income Snapshot
Below shows the total revenue, net income and net margin for Resmed Inc. More…
| Total Revenues | Net Income | Net Margin |
| 4.22k | 897.56 | 21.1% |
Cash Flow Snapshot
Below shows the cash from operations, investing and financing for Resmed Inc. More…
| Operations | Investing | Financing |
| 693.3 | -1.16k | 422.87 |
Balance Sheet Snapshot
Below shows the total assets, liabilities and book value per share for Resmed Inc. More…
| Total Assets | Total Liabilities | Book Value Per Share |
| 6.75k | 2.62k | 28.11 |
Key Ratios Snapshot
Some of the financial key ratios for Resmed Inc are shown below. More…
| 3Y Rev Growth | 3Y Operating Profit Growth | Operating Margin |
| 12.6% | 12.5% | 27.3% |
| FCF Margin | ROE | ROA |
| 13.2% | 17.9% | 10.7% |
Peers
ResMed’s competitors include Natus Medical Inc, Sanara MedTech Inc, and Avita Corp.
– Natus Medical Inc ($NASDAQ:SMTI)
As of 2022, Sanara MedTech Inc has a market cap of 227.36M and a Return on Equity of -22.91%. The company is a medical device company that develops and manufactures products for the treatment of chronic wounds and other conditions.
– Sanara MedTech Inc ($TPEX:4735)
Avita Corp is a biotechnology company that develops, manufactures, and markets products based on regenerative medicine. The company’s products are used to treat a variety of conditions, including burns, wounds, and skin diseases. Avita’s products are sold in over 30 countries worldwide. The company has a market cap of 1.21B as of 2022 and a return on equity of 9.62%.
Summary
RESMED INC has experienced significant growth in the fourth quarter ending June 30, 2023 with total revenue rising to USD 1122.1 million – up 22.7% from the same period the previous year. Net income increased 17.7% year over year to USD 229.7 million. Investing in RESMED INC may be a sound decision as the company has shown impressive revenue growth and profitability. With its strong performance in the fourth quarter and future outlook, it may be a worthwhile addition to any portfolio.


