Peabody Energy Intrinsic Value Calculator – PEABODY ENERGY Reports Record-Breaking Q2 Revenue of USD 1268.8 Million for FY2023
August 4, 2023

☀️Earnings Overview
On July 27 2023, PEABODY ENERGY ($NYSE:BTU) reported total revenue of USD 1268.8 million for the second quarter of their fiscal year 2023, ending June 30 2023, which was a 4.0% decrease from the same period of the preceding year. Net income also dropped 56.2% compared to the same quarter of the previous year, to USD 179.2 million.
Market Price
The company’s stock opened at $21.7 and closed at the same price, which was a 3.3% decrease from the previous closing price of 22.4. Investors were disappointed with the results, but the company remains optimistic about its future prospects. PEABODY ENERGY is the world’s largest private-sector coal company and produces coal from twenty-one mining complexes in the United States and Australia. The company has a strong focus on creating value for its shareholders and is committed to being a leader in environmental stewardship.
The Q2 revenue may have been down 3.3%, but PEABODY ENERGY has achieved stellar growth in recent years and continues to invest in technology and resources to stay ahead of the changing energy landscape. With an enviable portfolio of assets and a commitment to providing clean, reliable energy, the company is well-positioned to capitalize on the ever-changing energy landscape. Live Quote…
About the Company
Income Snapshot
Below shows the total revenue, net income and net margin for Peabody Energy. More…
| Total Revenues | Net Income | Net Margin |
| 5.6k | 1.45k | 27.0% |
Cash Flow Snapshot
Below shows the cash from operations, investing and financing for Peabody Energy. More…
| Operations | Investing | Financing |
| 1.9k | -243.2 | -982.1 |
Balance Sheet Snapshot
Below shows the total assets, liabilities and book value per share for Peabody Energy. More…
| Total Assets | Total Liabilities | Book Value Per Share |
| 5.83k | 2.3k | 23.81 |
Key Ratios Snapshot
Some of the financial key ratios for Peabody Energy are shown below. More…
| 3Y Rev Growth | 3Y Operating Profit Growth | Operating Margin |
| 14.9% | 83.7% | 31.3% |
| FCF Margin | ROE | ROA |
| 29.0% | 31.7% | 18.8% |
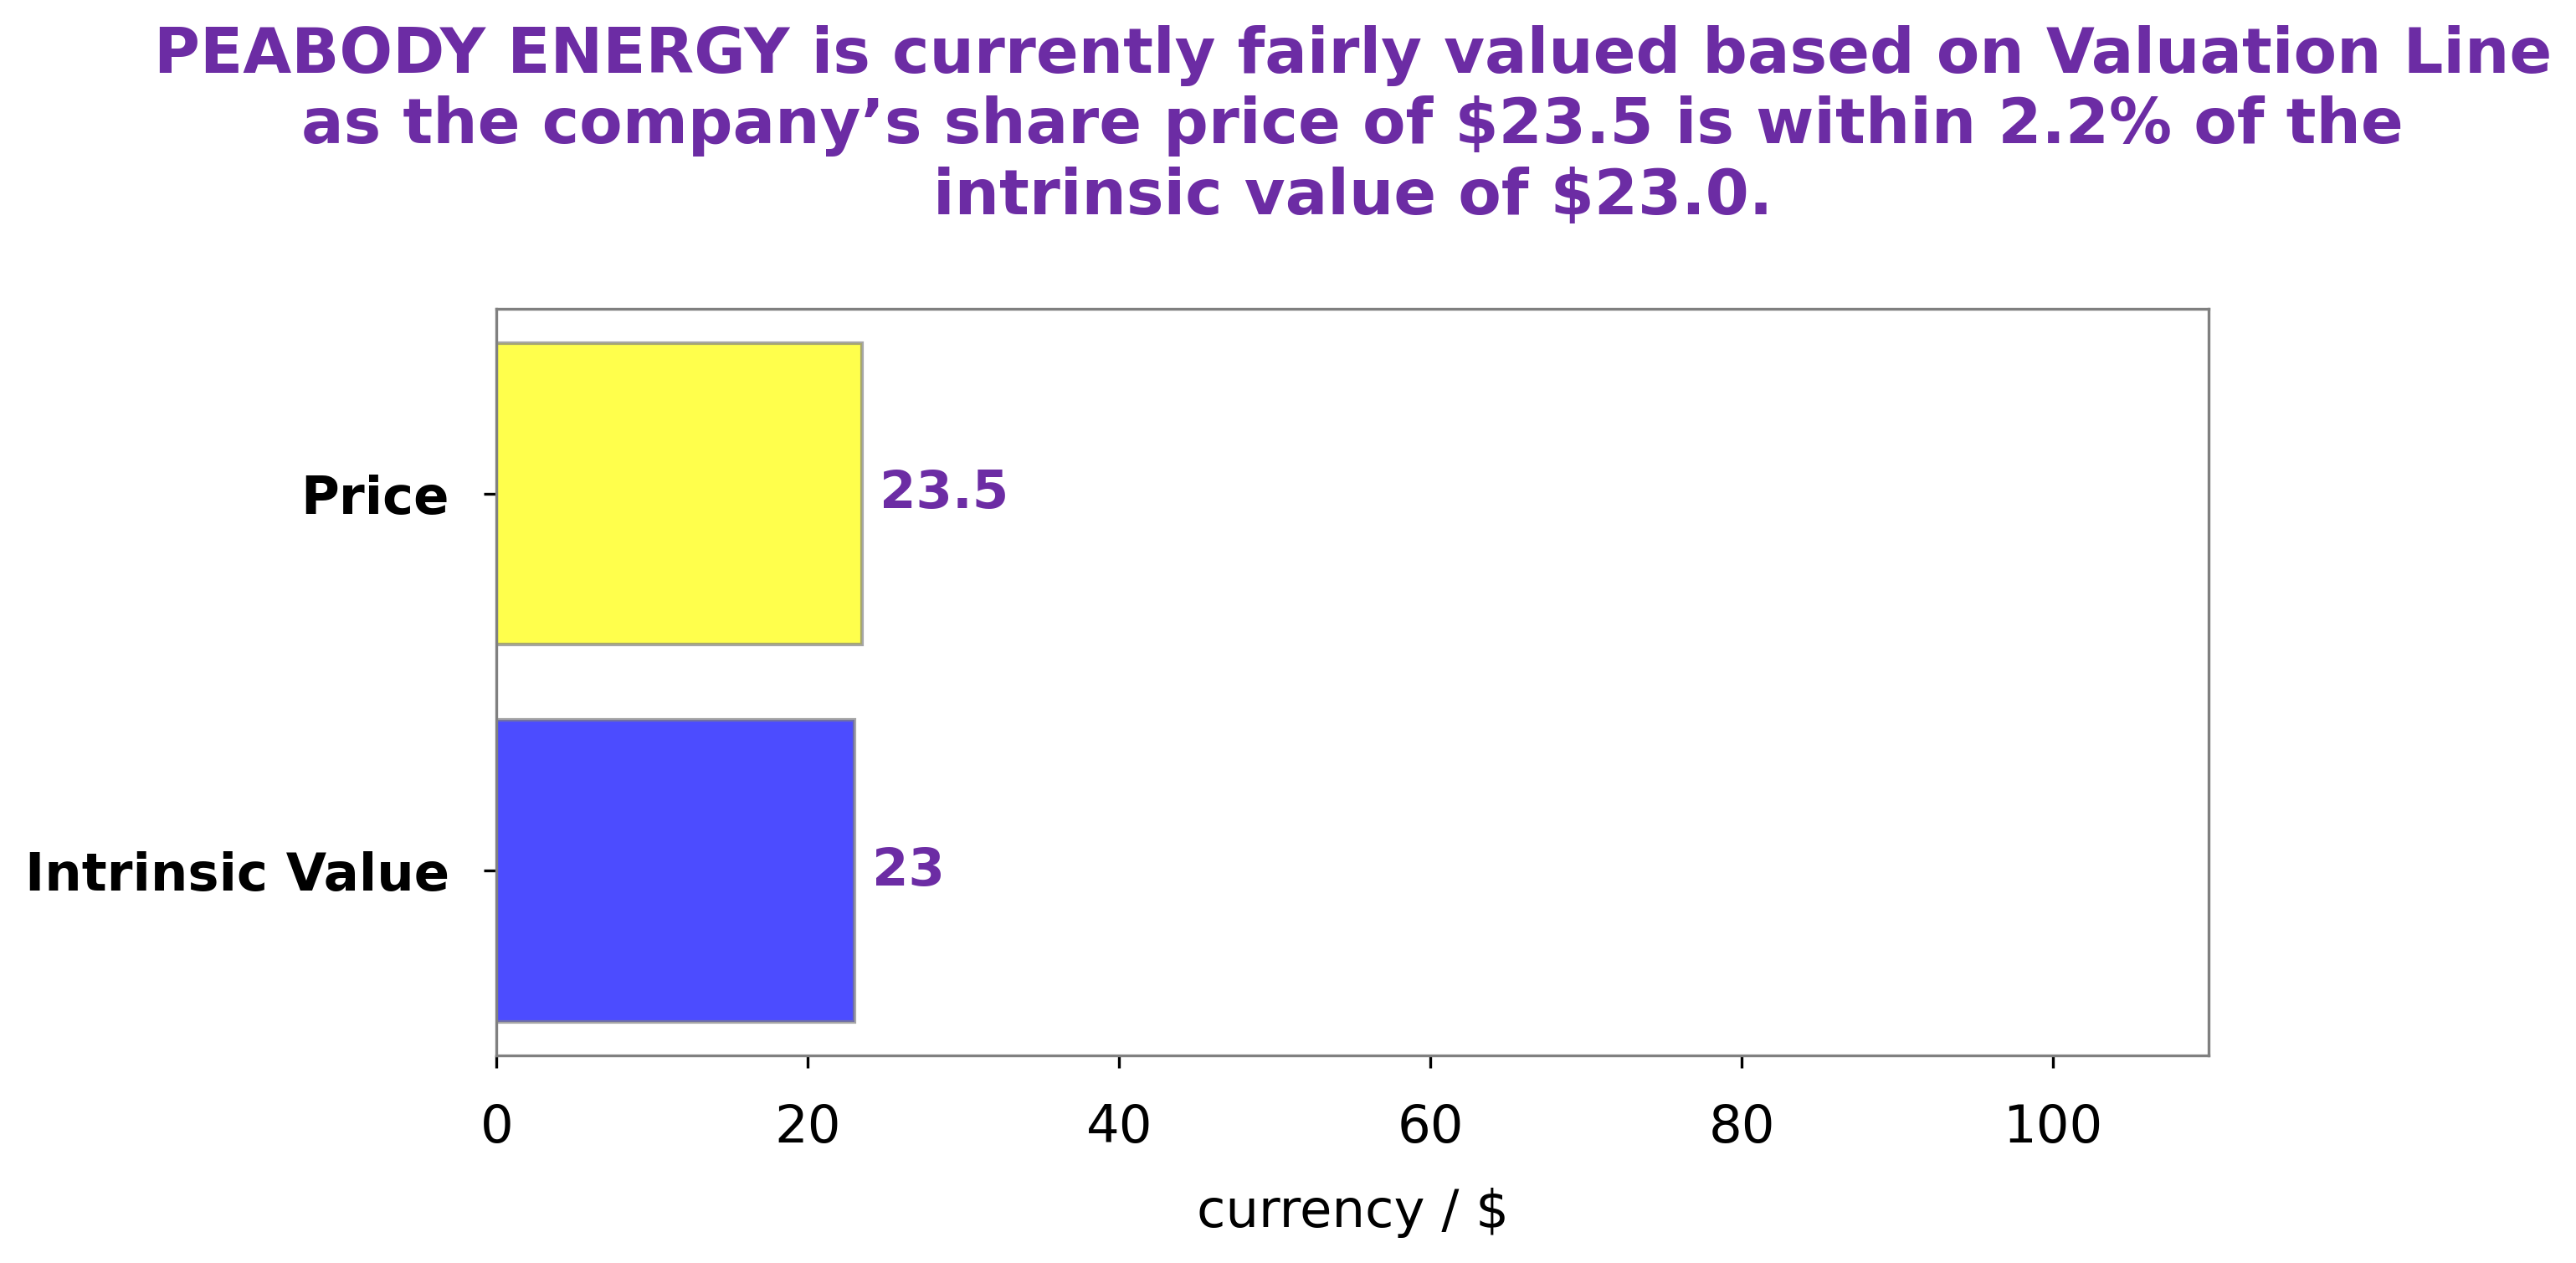
Analysis – Peabody Energy Intrinsic Value Calculator
At GoodWhale, we have conducted a thorough analysis of PEABODY ENERGY‘s fundamentals. After extensive research, our proprietary Valuation Line determined the intrinsic value of PEABODY ENERGY share to be around $19.6. Currently, the stock is trading at $21.7, making it a fair price that is slightly overvalued by 10.9%. More…
Peers
In the coal industry, there is stiff competition among the top companies. Peabody Energy Corp, Alliance Resource Partners LP, CONSOL Energy Inc, and Arch Resources Inc are all vying for a piece of the pie. Each company has its own strengths and weaknesses, and it is up to the consumer to decide which company they want to support.
– Alliance Resource Partners LP ($NASDAQ:ARLP)
Alliance Resource Partners LP is a leading producer and marketer of coal in the United States. The company has a market cap of $3.06 billion and a return on equity of 19.31%. Alliance Resource Partners LP is engaged in the business of mining, processing and selling coal to electric utilities and metallurgical coal customers. The company operates mines in Illinois, Indiana, Kentucky, Maryland, Pennsylvania, Virginia and West Virginia.
– CONSOL Energy Inc ($NYSE:CEIX)
CONSOL Energy Inc. is a coal and natural gas company. It has a market cap of 2.2B as of 2022 and a ROE of 40.18%. The company has a diversified portfolio of high-quality assets including the Marcellus Shale, the Utica Shale, the Barnett Shale, and the Appalachian Basin. The company is committed to providing safe and reliable energy to its customers and is one of the largest producers of both coal and natural gas in the United States.
– Arch Resources Inc ($NYSE:ARCH)
Arch Resources, Inc. operates as a metallurgical coal and thermal coal producer for the steel and power generation industries. It owns and operates coal mines in Wyoming, Colorado, West Virginia, Kentucky, Virginia, and Illinois. As of December 31, 2020, the company had estimated recoverable reserves of 1.1 billion tons of coal. Arch Resources, Inc. was founded in 1969 and is headquartered in St. Louis, Missouri.
Summary
PEABODY ENERGY reported a 4.0% decline in total revenue for the second quarter of their fiscal year 2023, ending June 30 2023, on July 27 2023, compared to the same period of the previous year. Net income decreased by 56.2%, also compared to the same quarter of the previous year, to USD 179.2 million. These results were reflected in the stock price which moved down the same day. Investors should closely monitor PEABODY ENERGY’s performance and outlook in light of these results, analyze its financials, and consider the macro environment before investing.


