NEWMONT CORPORATION Reports 12.3% Decrease in Total Revenue for Q2 FY2023
July 26, 2023

🌥️Earnings Overview
NEWMONT CORPORATION ($NYSE:NEM) reported their FY2023 second quarter earnings on June 30 2023, showing a total revenue of USD 2683.0 million, a drop of 12.3% from the same period a year ago. Net income also decreased by 59.9% to USD 155.0 million from the prior year’s second quarter.
Analysis
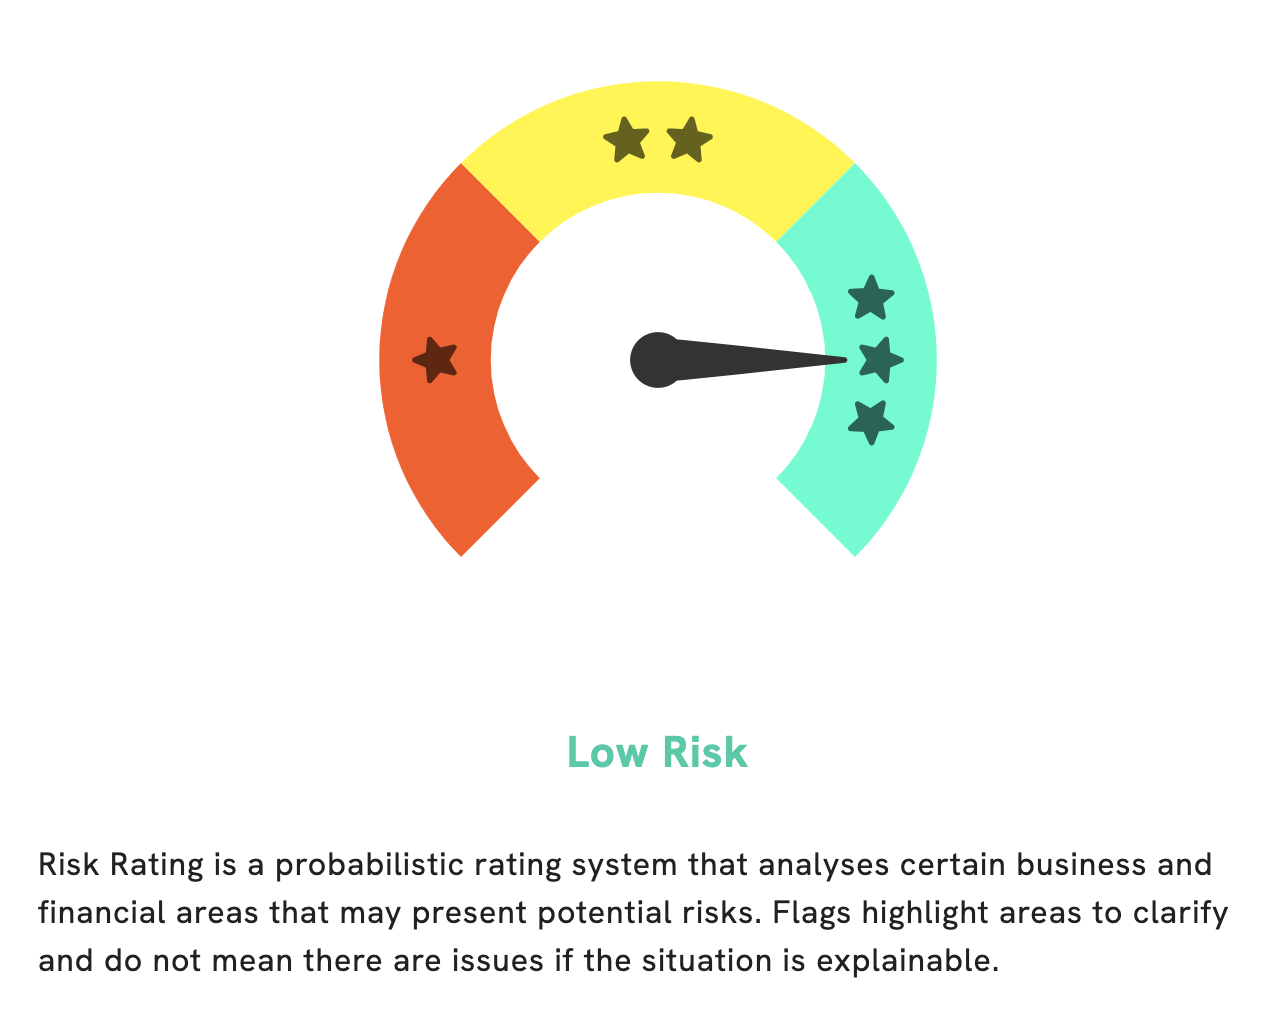
GoodWhale has conducted an analysis of NEWMONT CORPORATION‘s fundamentals and given it a Risk Rating of low risk. This assessment takes into account financial and business aspects of the company and serves as a guideline for potential investors. GoodWhale has identified two risk warnings in the income sheet and balance sheet of the company but further details can be found on GoodWhale’s website. By registering with GoodWhale, investors can access detailed information about NEWMONT CORPORATION and make an informed decision about investing in the company. More…
About the Company
Income Snapshot
Below shows the total revenue, net income and net margin for Newmont Corporation. More…
| Total Revenues | Net Income | Net Margin |
| 11.2k | -758 | -0.1% |
Cash Flow Snapshot
Below shows the cash from operations, investing and financing for Newmont Corporation. More…
| Operations | Investing | Financing |
| 2.63k | -2.45k | -1.62k |
Balance Sheet Snapshot
Below shows the total assets, liabilities and book value per share for Newmont Corporation. More…
| Total Assets | Total Liabilities | Book Value Per Share |
| 38.13k | 18.72k | 24.24 |
Key Ratios Snapshot
Some of the financial key ratios for Newmont Corporation are shown below. More…
| 3Y Rev Growth | 3Y Operating Profit Growth | Operating Margin |
| 1.8% | -18.1% | -0.2% |
| FCF Margin | ROE | ROA |
| 2.8% | -0.1% | -0.0% |
Peers
Newmont Corp is one of the world’s leading gold miners. Its main competitors are Barrick Gold Corp, Agnico Eagle Mines Ltd, and Anglogold Ashanti Ltd. Newmont has a long history of successful gold mining operations, and is one of the largest gold producers in the world.
– Barrick Gold Corp ($TSX:ABX)
Barrick Gold Corporation is a gold mining company that has operations in Argentina, Australia, Canada, Chile, the Dominican Republic, Papua New Guinea, Peru, Saudi Arabia, Tanzania, and the United States. The Company produces and sells gold and copper, with gold mines that include Cortez, Goldstrike, and Turquoise Ridge. Barrick also has a joint venture with Newmont Corporation. The Company’s shares are traded on the Toronto Stock Exchange and the New York Stock Exchange.
– Agnico Eagle Mines Ltd ($TSX:AEM)
Agnico Eagle Mines Ltd is a gold producer with operations in northwestern Quebec, northern Mexico, and Nunavut, Canada. The company has a market cap of 26.78 billion as of 2022 and a return on equity of 4.04%. Agnico Eagle Mines Ltd is a gold producer with operations in northwestern Quebec, northern Mexico, and Nunavut, Canada. The company has a market cap of 26.78 billion as of 2022 and a return on equity of 4.04%.
– Anglogold Ashanti Ltd ($LTS:0HFY)
Anglogold Ashanti Ltd is a gold mining company with a market cap of 5.28B as of 2022. The company has a return on equity of 15.08%. Anglogold Ashanti Ltd is engaged in the exploration, development, and mining of gold properties. The company was founded in 1944 and is headquartered in Johannesburg, South Africa.
Summary
Newmont Corporation reported their second quarter of FY2023 earnings on June 30 2023, with total revenue of USD 2683.0 million, a decrease of 12.3% compared to the same period last year. Net income was USD 155.0 million, a decline of 59.9% from the same period in the prior year. These financial results suggest that Newmont Corporation’s business performance has suffered over the past year, with a significant decline in both revenue and profits.
As such, investors may want to consider the potential risk associated with investing in Newmont Corporation. The stock price has also dropped to reflect the poor results, suggesting that investors may want to wait for a recovery in the company’s performance before taking any investment action.
Related Posts


Recent Posts


