HUB GROUP Reports 25.8% Decrease in Total Revenue for Q2 of 2023
August 9, 2023

🌥️Earnings Overview
On July 27, 2023, HUB GROUP ($NASDAQ:HUBG) reported total revenue of USD 1040.5 million for the quarter ended June 30, 2023, a decrease of 25.8% year-over-year. Net income for the period was USD 46.5 million, a decrease of 54.8% compared to the prior year same quarter.
Analysis
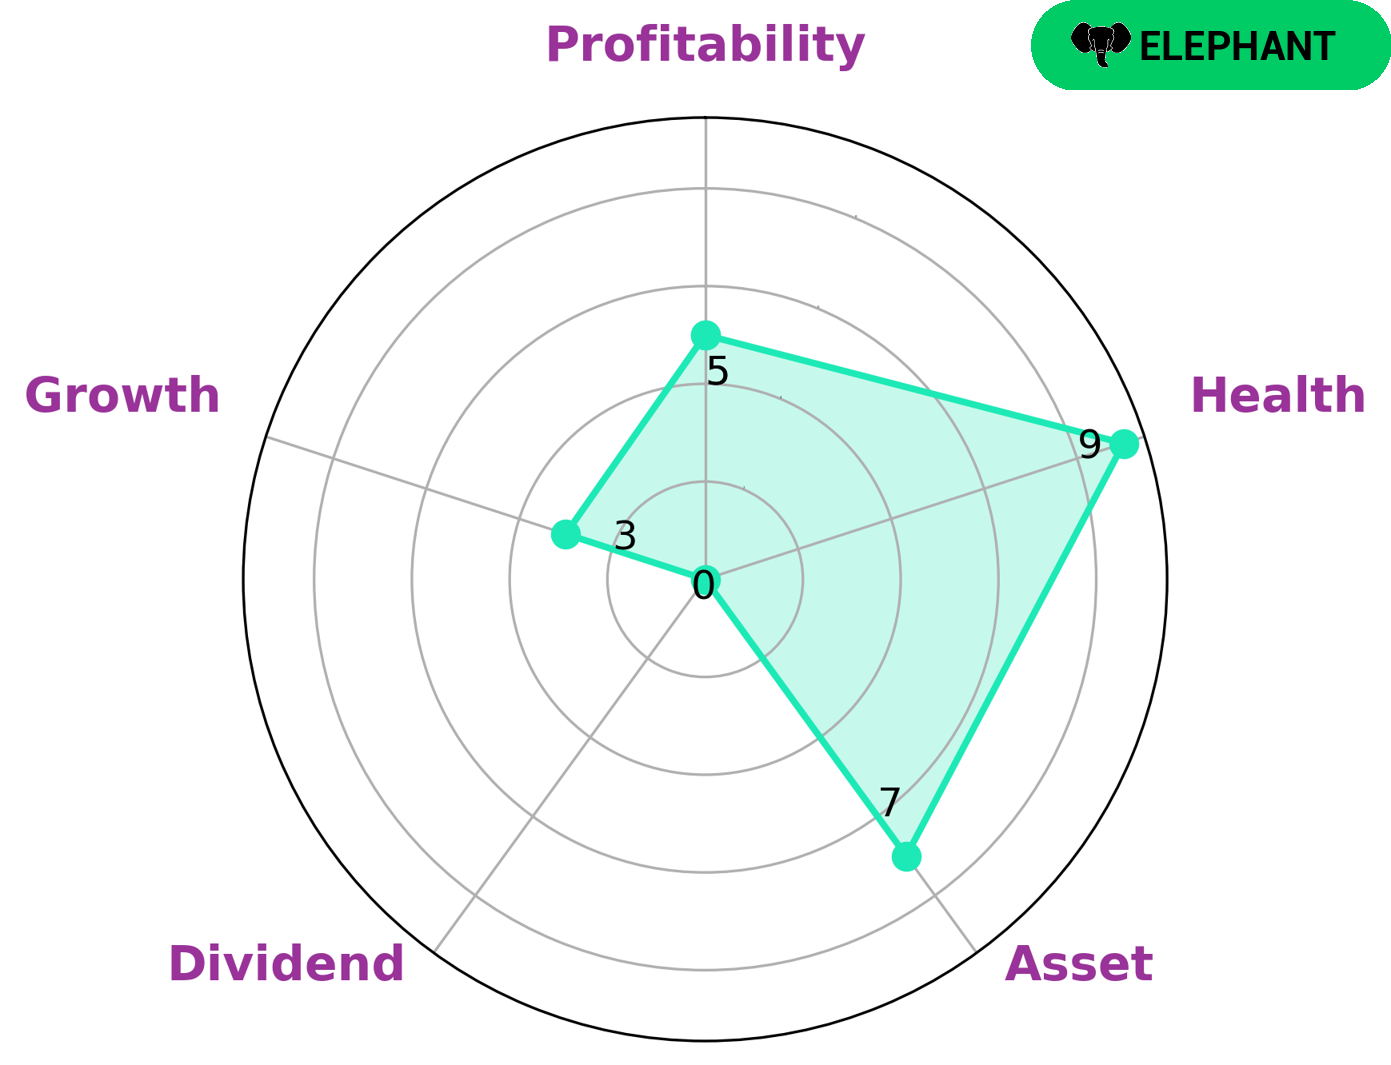
The financials of HUB GROUP have been analyzed by GoodWhale and classified according to the Star Chart as a ‘rhino’ type of company. This type of company has achieved moderate revenue or earnings growth. Investors who may be interested in HUB GROUP are those that are looking for an established company with strong assets and medium growth, profitability and dividend potential. The company’s health score of 10/10 with regard to its cashflows and debt is reassuring and suggests that the company is capable to safely ride out any crisis without the risk of bankruptcy. It is predicted that with a strong foundation, HUB GROUP is sure to continue to grow and expand in the future. More…
About the Company
Income Snapshot
Below shows the total revenue, net income and net margin for Hub Group. More…
| Total Revenues | Net Income | Net Margin |
| 4.83k | 274.88 | 5.6% |
Cash Flow Snapshot
Below shows the cash from operations, investing and financing for Hub Group. More…
| Operations | Investing | Financing |
| 478.81 | -261.91 | -173.01 |
Balance Sheet Snapshot
Below shows the total assets, liabilities and book value per share for Hub Group. More…
| Total Assets | Total Liabilities | Book Value Per Share |
| 2.8k | 1.19k | 50.37 |
Key Ratios Snapshot
Some of the financial key ratios for Hub Group are shown below. More…
| 3Y Rev Growth | 3Y Operating Profit Growth | Operating Margin |
| 12.1% | 45.2% | 7.6% |
| FCF Margin | ROE | ROA |
| 5.8% | 14.0% | 8.2% |
Peers
The competition in the logistics industry is fierce. Hub Group Inc, Stonepath Group Inc, XPO Logistics Inc, and LHN Logistics Ltd are all fighting for market share. Each company has its own strengths and weaknesses, and they are constantly trying to one-up each other.
– Stonepath Group Inc ($OTCPK:SGRZ)
The company’s market cap is $4.38k and its ROE is -2.67%. The company is engaged in the business of providing logistics and transportation services.
– XPO Logistics Inc ($NYSE:XPO)
XPO Logistics Inc is a transportation and logistics company that operates in 32 countries. It has a market cap of 5.27B and a ROE of 42.78%. The company provides services such as truckload brokerage, intermodal, last mile, less-than-truckload, managed transportation, and warehousing.
Summary
Investors in HUB Group should be aware of the company’s second quarter results for the period ended June 30, 2023. The company reported a total revenue of USD 1040.5 million, a decrease of 25.8% compared to the same quarter in the prior year. Net income for the period was USD 46.5 million, a decrease of 54.8% compared to the prior year. This represents a substantial decline in profitability for the company, and would indicate that investors may want to wait for the company to turn around its performance before investing.
Additionally, investors should continue to monitor HUB Group’s performance for signs of improvement before investing in the company.
Related Posts


Recent Posts


