Ecolab Inc Intrinsic Value Calculator – ECOLAB INC Reports Profitable Second Quarter of FY2023
August 9, 2023

☀️Earnings Overview
ECOLAB INC ($NYSE:ECL) reported their financial results for the second quarter of FY2023, which concluded on June 30, 2023. Total revenue for the quarter totaled USD 3852.1 million, a 7.6% rise on the same period in the previous year. Net income for the quarter was USD 329.7 million, a 6.9% increase from the same time frame the prior year.
Market Price
Their stock opened up at $182.9 and closed at $185.2, a 1.1% increase from its previous closing price of 183.1. This marks the company’s successful continuation of their positive earning streak since the start of FY2023. Throughout this quarter, the company has seen revenue and profits steadily grow due to their commitment to innovation and customer service. They have also invested heavily in research and development to support their growth in new markets and products. As a result of their strategic investments, they were able to capitalize on the growing demand for their services and products in the market. Furthermore, ECOLAB Inc has been focusing on sustainability initiatives to ensure that their products and services are environmentally friendly.
They have also taken steps to increase their energy efficiency and reduce their overall carbon footprint. Their dedication to their sustainability goals has earned them public recognition in the industry and helped them to further increase their customer base. Their stock increase of 1.1% is only the beginning of what seems to be a trend of continued success for the company. As they look towards the future, they are well-positioned to capitalize on new market opportunities and continue to build upon their existing customer base. Live Quote…
About the Company
Income Snapshot
Below shows the total revenue, net income and net margin for Ecolab Inc. More…
| Total Revenues | Net Income | Net Margin |
| 14.76k | 1.17k | 8.8% |
Cash Flow Snapshot
Below shows the cash from operations, investing and financing for Ecolab Inc. More…
| Operations | Investing | Financing |
| 1.82k | -716.8 | -837.3 |
Balance Sheet Snapshot
Below shows the total assets, liabilities and book value per share for Ecolab Inc. More…
| Total Assets | Total Liabilities | Book Value Per Share |
| 21.46k | 13.88k | 26.54 |
Key Ratios Snapshot
Some of the financial key ratios for Ecolab Inc are shown below. More…
| 3Y Rev Growth | 3Y Operating Profit Growth | Operating Margin |
| 0.6% | -2.7% | 11.8% |
| FCF Margin | ROE | ROA |
| 7.3% | 14.6% | 5.1% |
Analysis – Ecolab Inc Intrinsic Value Calculator
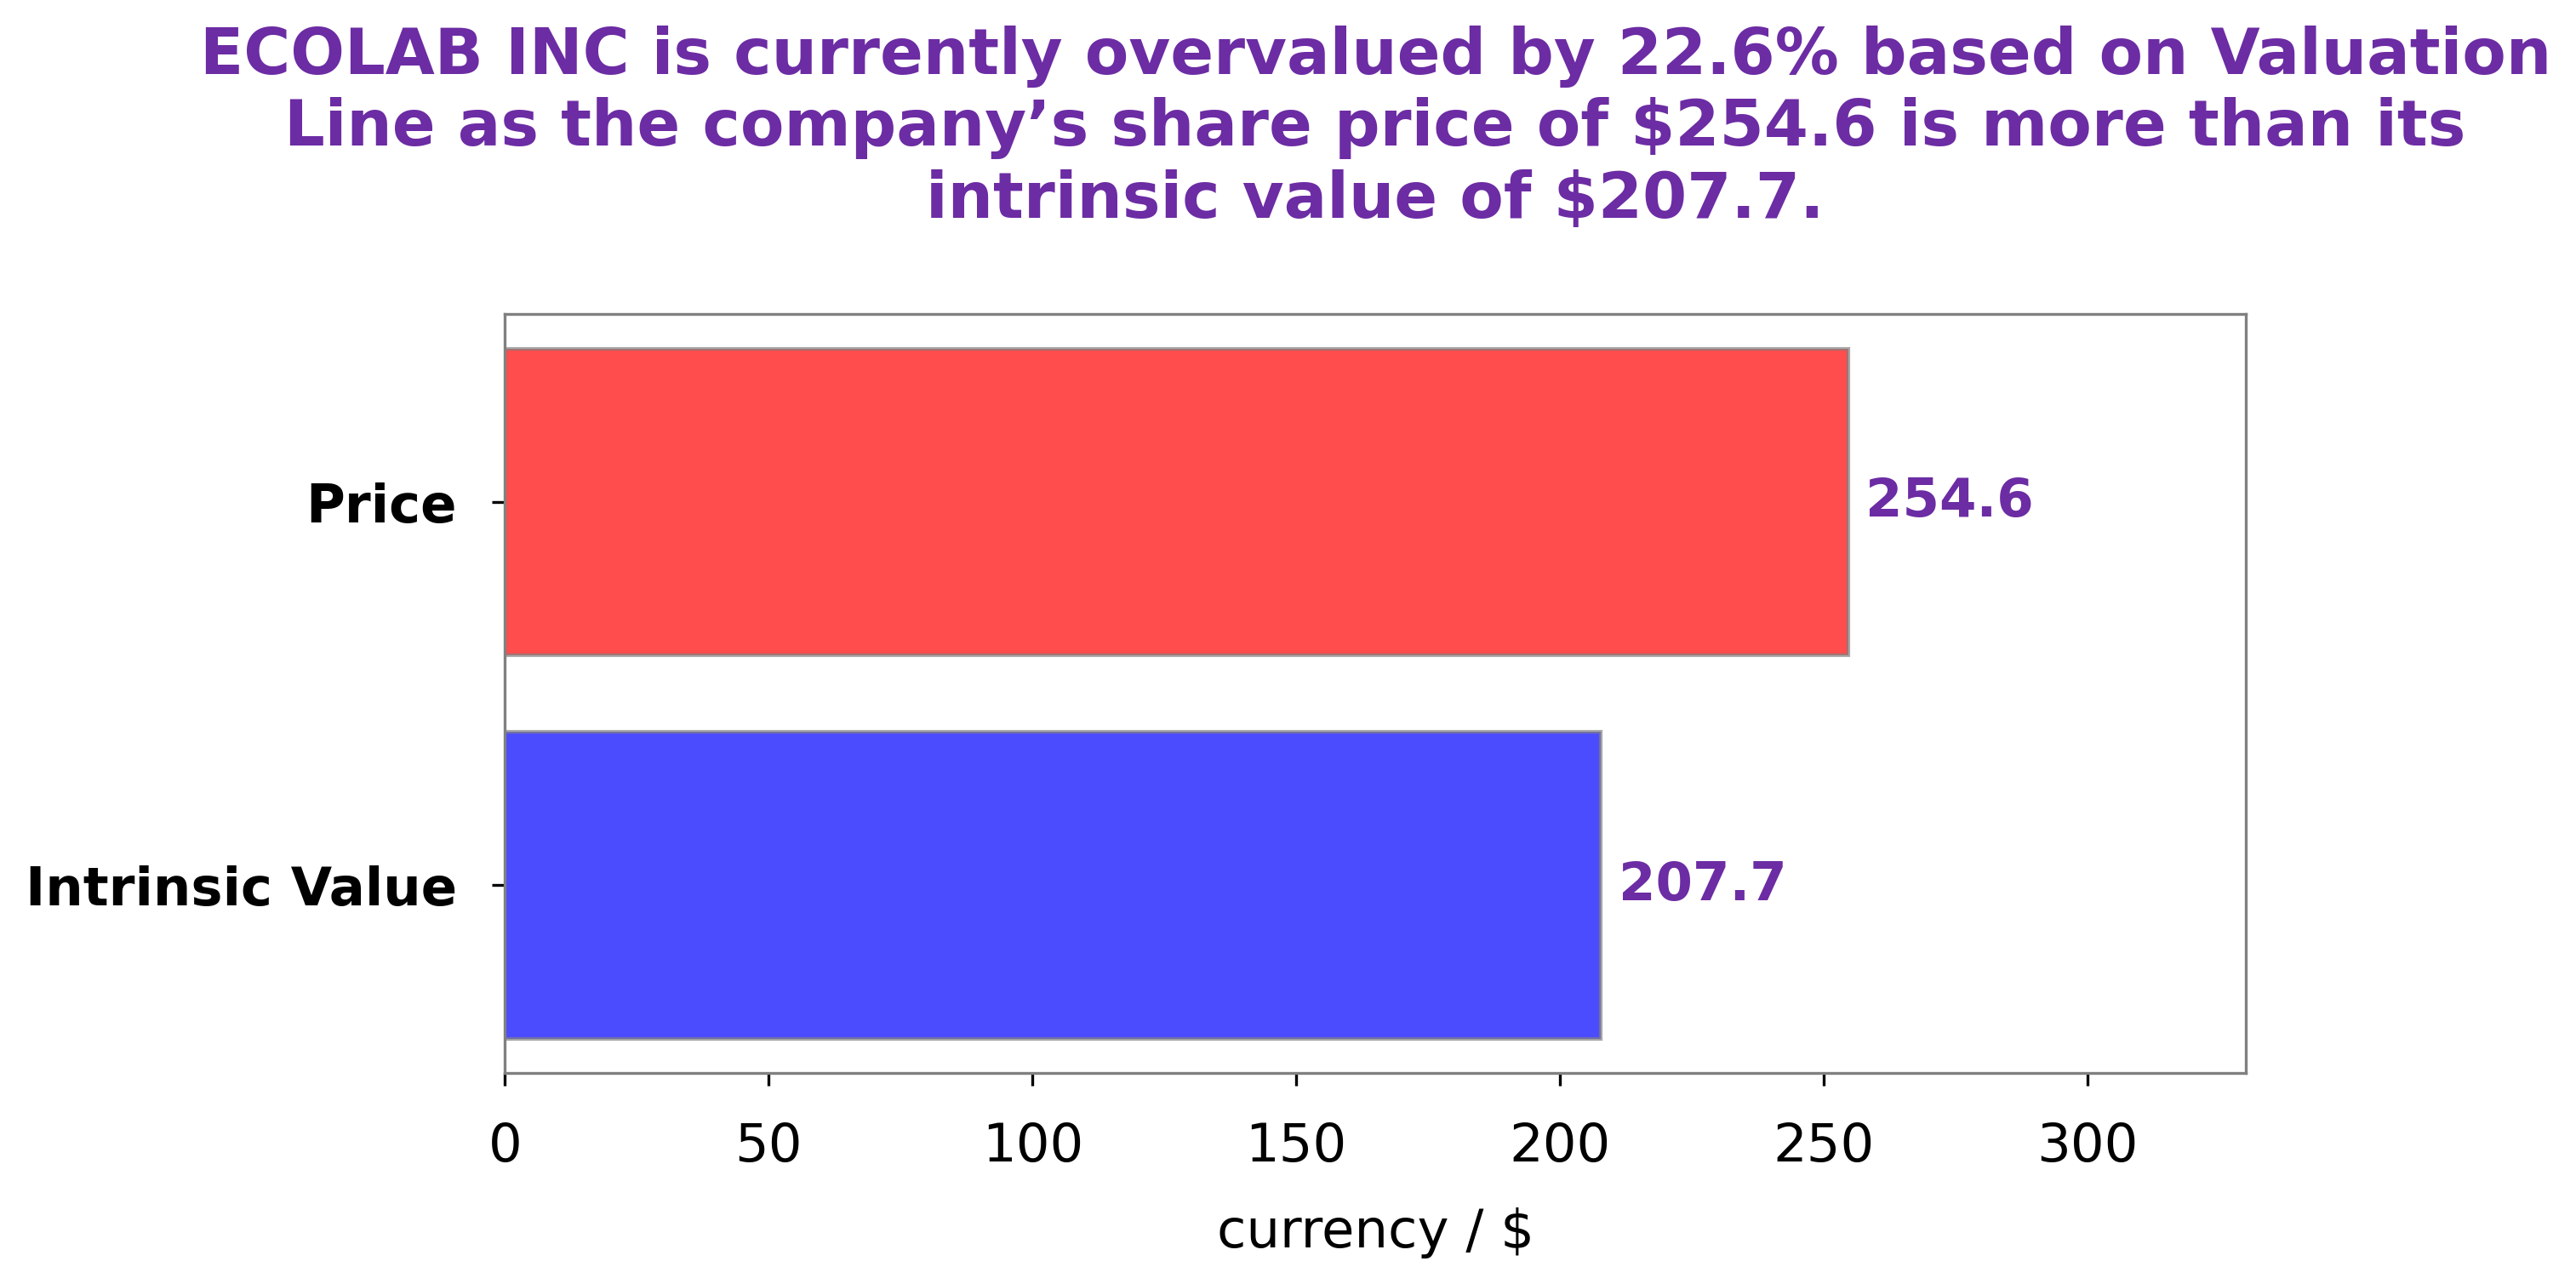
At GoodWhale, we recently examined the fundamentals of ECOLAB INC and have determined that it is currently undervalued. By using our proprietary Valuation Line, we have calculated the fair value of ECOLAB INC’s stock to be around $213.4. However, the current market price of ECOLAB INC’s stock is $185.2, meaning it is undervalued by 13.2%. This is an excellent opportunity for investors to benefit from the current market conditions and purchase ECOLAB INC’s stock at a discounted price. More…
Peers
Ecolab Inc is a US company that provides water, hygiene and energy technologies and services. Its main competitors are Incitec Pivot Ltd, Givaudan SA and C-Bond Systems Inc.
– Incitec Pivot Ltd ($ASX:IPL)
Incitec Pivot Ltd is an Australian manufacturer and supplier of industrial chemicals and fertilizers. It has a market cap of $6.95 billion and a return on equity of 10.44%. The company produces and supplies a range of products including ammonia, urea, nitric acid, and phosphate fertilizers. It also manufactures and supplies explosives for the mining, quarrying, and construction industries.
– Givaudan SA ($OTCPK:GVDNY)
Givaudan SA is a Swiss company that produces flavors and fragrances. The company has a market cap of 27.11B as of 2022 and a Return on Equity of 15.84%. The company’s products are used in food, beverages, cosmetics, and other consumer products.
– C-Bond Systems Inc ($OTCPK:CBNT)
C-Bond Systems Inc is a company that manufactures and sells products that are used to repair and strengthen concrete. The company has a market cap of 3.46M as of 2022 and a ROE of 105.36%. The company’s products are used in a variety of applications, including repairing cracks in concrete, strengthening concrete structures, and sealing concrete surfaces.
Summary
ECOLAB INC’s second quarter of FY2023 results are encouraging for investors, as revenue increased 7.6% year-on-year to USD 3852.1 million, while net income rose 6.9% to USD 329.7 million. The company’s income margins have improved significantly and its operating profitability remains healthy. Furthermore, its balance sheet appears to be strengthening with a drop in long-term debt and an increase in cash and cash equivalents. All in all, the company’s financial performance is indicative of a strong positioning in the market, making it an attractive investment option in the near term.


