COSTAR GROUP Reports 13.0% Increase in Total Revenue for 2nd Quarter Ending June 30 2023
August 24, 2023

☀️Earnings Overview
COSTAR GROUP ($NASDAQ:CSGP) announced on July 25 2023 that total revenue for the second quarter ending June 30 2023 had grown 13.0% to USD 605.9 million compared to the same period in the previous fiscal year. Additionally, net income had increased 20.4% year-over-year to USD 100.5 million.
Analysis
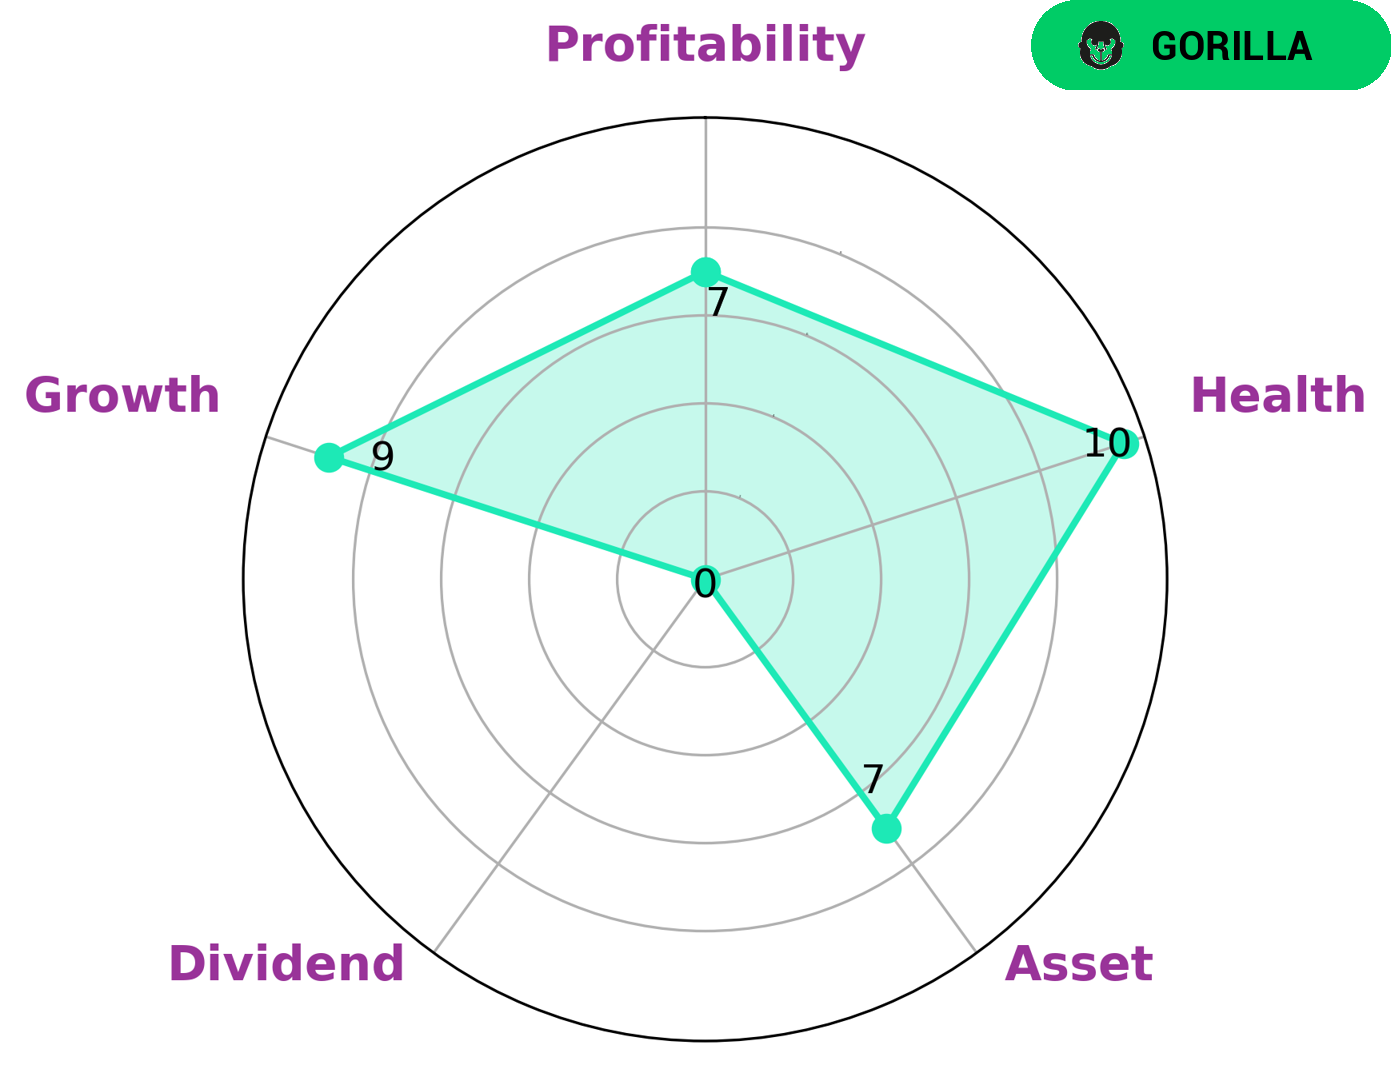
GoodWhale has conducted a thorough analysis of COSTAR GROUP‘s fundamentals. The Star Chart suggests that COSTAR GROUP is strong in its assets, growth and profitability, yet weak in its dividends. Based on this, COSTAR GROUP has been classified as a ‘gorilla’, a type of company that has achieved stable and high revenue or earnings growth due to its strong competitive advantage. This type of company may be of particular interest to investors looking for a reliable source of profits with the potential for growth. In addition, the company’s high health score, 10/10, indicates it is capable of sustaining future operations even in times of crisis thanks to its strong cashflows and low debt. This makes it an attractive option for those looking for a reliable long-term investment. More…
About the Company
Income Snapshot
Below shows the total revenue, net income and net margin for Costar Group. More…
| Total Revenues | Net Income | Net Margin |
| 2.32k | 384.31 | 16.6% |
Cash Flow Snapshot
Below shows the cash from operations, investing and financing for Costar Group. More…
| Operations | Investing | Financing |
| 564.9 | -65.77 | 742.28 |
Balance Sheet Snapshot
Below shows the total assets, liabilities and book value per share for Costar Group. More…
| Total Assets | Total Liabilities | Book Value Per Share |
| 8.69k | 1.59k | 17.05 |
Key Ratios Snapshot
Some of the financial key ratios for Costar Group are shown below. More…
| 3Y Rev Growth | 3Y Operating Profit Growth | Operating Margin |
| 15.2% | 1.1% | 15.6% |
| FCF Margin | ROE | ROA |
| 22.8% | 3.2% | 2.6% |
Peers
CoStar Group Inc is a commercial real estate information and analytics company. Its competitors are Altus Group Ltd, Aroundtown SA, and Belpointe PREP LLC.
– Altus Group Ltd ($TSX:AIF)
Altus Group is a leading provider of independent advisory services, software and data solutions to the global commercial real estate industry. Our integrity, innovative technology and comprehensive data and analytics enable us to help our clients make informed decisions and drive business value. We have a deep understanding of the forces shaping the commercial real estate industry and a proven track record of helping our clients achieve their business objectives.
– Aroundtown SA ($LTS:0RUH)
The company’s market capitalization is $2.75 billion and its return on equity is 7.46%. The company is a real estate investment trust that owns, operates, and develops properties in Germany.
– Belpointe PREP LLC ($NYSEAM:OZ)
As of 2022, Belpointe PREP LLC has a market cap of 302.88M and a Return on Equity of -1.62%. The company is a provider of educational services. It offers a variety of services to its students, including academic advising, tutoring, and college counseling. Belpointe PREP LLC is committed to providing its students with the skills and knowledge necessary to succeed in their academic pursuits.
Summary
COSTAR GROUP released its financial results for the second quarter ending June 30 2023, showing total revenue of USD 605.9 million and net income of USD 100.5 million, up 13.0% and 20.4%, respectively, from the same period in the previous fiscal year. This suggests that the company’s performance is continuing to improve. The underlying fundamentals are strong and suggest that now may be a good time to invest in COSTAR GROUP. Investors should consider the company’s future prospects and profitability, as well as its potential risks.
Related Posts


Recent Posts


