APPLIED MATERIALS Reports Record Profits for FY2023 Q3 Ending July 31st
August 20, 2023

☀️Earnings Overview
APPLIED MATERIALS ($NASDAQ:AMAT) reported total revenue of USD 6.4 billion for the third quarter of its fiscal year 2023, ending on July 31 2023, which was 1.5% lower compared to the same period last year. Net income for the quarter was USD 1.6 billion, a decrease of 3.1% year over year.
Price History
On Thursday, APPLIED MATERIALS reported record profits for the third fiscal quarter ending July 31st, with the company’s stock opening at $139.2 and closing at $137.6, down by 0.5% from the prior closing price of 138.2. Despite the marginal decrease in share price, APPLIED MATERIALS still had a notable quarter, surpassing their own expectations and setting record profits. The company benefited greatly from their investments in research and development, where their innovative new products and services helped to drive success throughout the quarter. APPLIED MATERIALS saw success in all areas of the business, with their semiconductor systems division leading the charge. The company also saw strong growth in its display and services segment, which grew nine percent year-over-year.
Investors were pleased with the results, as evidenced by the company’s stock performance during the quarter. Shares of APPLIED MATERIALS finished the quarter up nearly 10% from where they began the period, despite the slight decline on Thursday. Looking ahead, the company believes they are well-positioned to capitalize on new opportunities and continue to deliver strong financial results. Live Quote…
About the Company
Income Snapshot
Below shows the total revenue, net income and net margin for Applied Materials. More…
| Total Revenues | Net Income | Net Margin |
| 26.54k | 6.44k | 24.3% |
Cash Flow Snapshot
Below shows the cash from operations, investing and financing for Applied Materials. More…
| Operations | Investing | Financing |
| 8k | -1.24k | -3.69k |
Balance Sheet Snapshot
Below shows the total assets, liabilities and book value per share for Applied Materials. More…
| Total Assets | Total Liabilities | Book Value Per Share |
| 30.41k | 15.32k | 16.83 |
Key Ratios Snapshot
Some of the financial key ratios for Applied Materials are shown below. More…
| 3Y Rev Growth | 3Y Operating Profit Growth | Operating Margin |
| 17.7% | 24.8% | 29.1% |
| FCF Margin | ROE | ROA |
| 26.3% | 34.2% | 15.9% |
Analysis
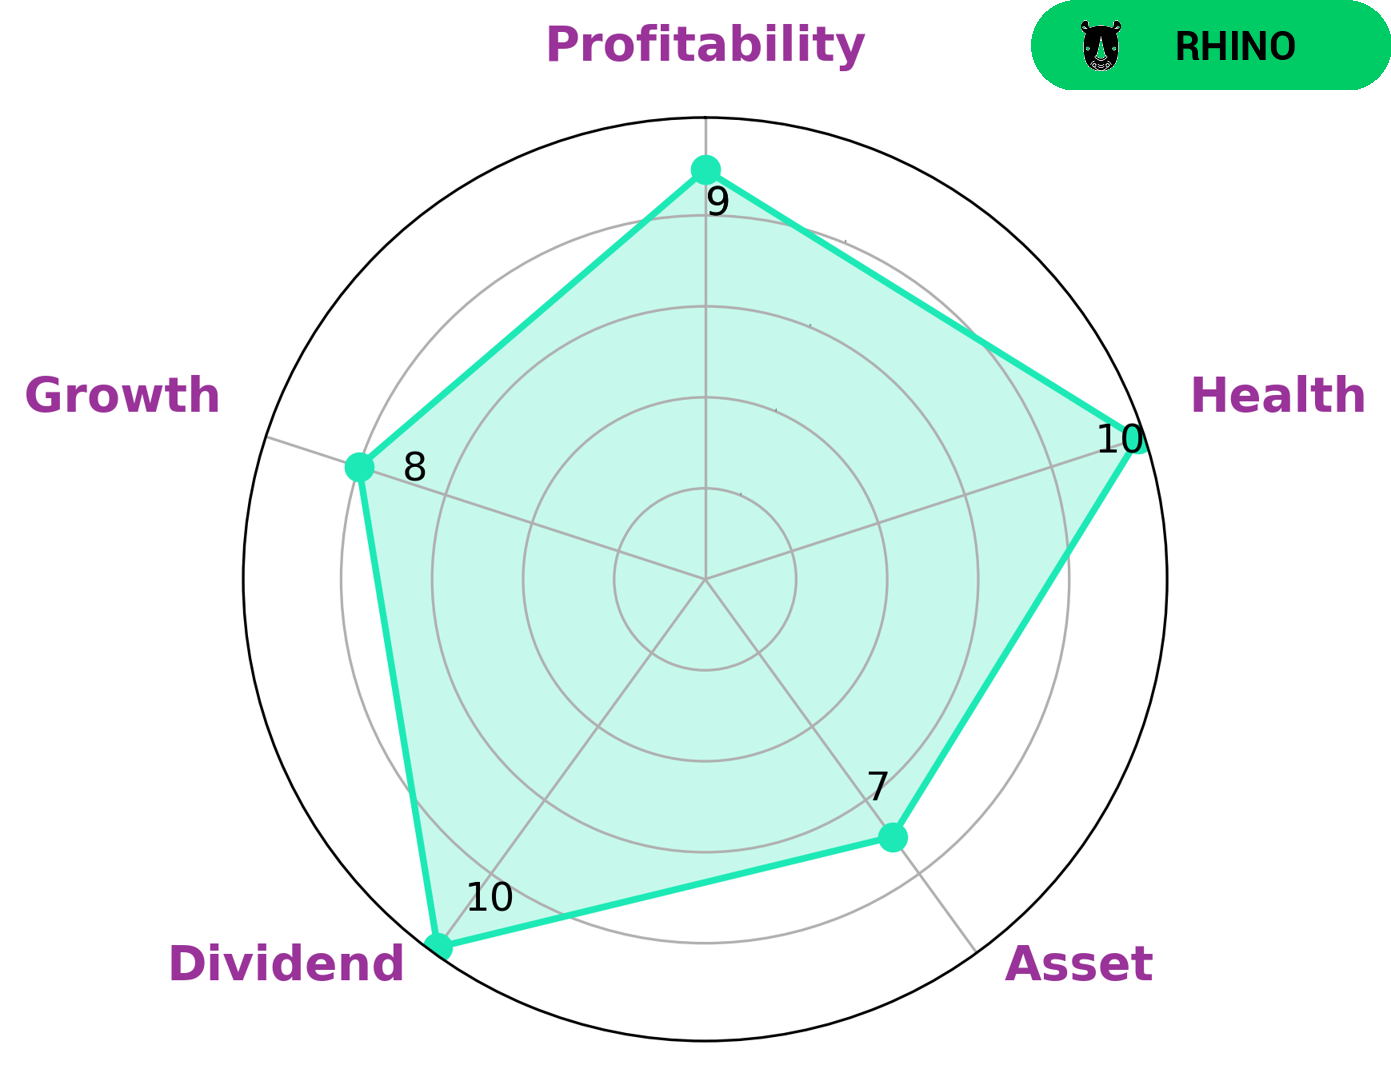
GoodWhale has analyzed the fundamentals of APPLIED MATERIALS and concluded that it has a high health score of 10/10 in terms of its cashflows and debt. This means that the company is well-prepared to sustain future operations even in times of crisis. Furthermore, APPLIED MATERIALS has strong performances in areas of dividend, growth, profitability, and is medium in asset. This gives us reason to classify APPLIED MATERIALS as a “gorilla” – a type of company that has achieved sustainable, high revenue or earnings growth due to its strong competitive advantage. This analysis makes it clear that APPLIED MATERIALS is an attractive choice for investors looking for a reliable growth stock. Investors interested in long-term growth and stability should seriously consider investing in APPLIED MATERIALS. More…
Peers
Applied Materials, Inc. and its competitors, Lam Research Corporation, KLA Corporation, and ASML Holding NV, compete in the semiconductor equipment industry. This industry is capital intensive, with high barriers to entry. The four companies have similar business models, but Applied Materials has a slight edge in terms of market share.
– Lam Research Corp ($NASDAQ:LRCX)
Lam Research Corporation is a company that manufactures semiconductor processing equipment. It is headquartered in Fremont, California, and has been in business since 1980. The company has a market capitalization of $51.81 billion as of 2022 and a return on equity of 54.63%. Lam Research Corporation is a leading supplier of wafer processing equipment to the semiconductor industry. The company’s products are used in the manufacturing of integrated circuits (ICs), which are the tiny electronic components that are found in everything from computers to cell phones. Lam Research Corporation’s products are used in all stages of IC production, from the initial deposition of materials on the wafer to the final etching of the completed circuits.
– KLA Corp ($NASDAQ:KLAC)
KLA Corp is a leader in process equipment and services for the semiconductor and nanoelectronics industries. The company has a market cap of $43.23 billion and a return on equity of 126.76%. KLA Corp provides products and services that enable the manufacturing of advanced semiconductor chips. The company’s products are used by customers in the fab process of making chips, including etching, metrology, and inspection. KLA Corp’s services enable customers to optimize their productivity and yield. The company has a strong history of innovation and is a trusted partner to the world’s leading chipmakers.
– ASML Holding NV ($NASDAQ:ASML)
ASML Holding NV is a technology company that manufactures semiconductor processing equipment, which is used in the production of integrated circuits (ICs). ASML’s products are used by customers in the computer, communications, and consumer electronics industries. The company has a market cap of 187.16B as of 2022 and a return on equity of 39.55%. ASML is headquartered in the Netherlands and has offices in Europe, the United States, Asia, and Japan.
Summary
APPLIED MATERIALS released their FY2023 Q3 earnings results on July 31st, with total revenue dropping by 1.5% to USD 6.4 billion compared to the same quarter last year. Net income fell 3.1% to USD 1.6 billion. This suggests that investor sentiment in APPLIED MATERIALS is waning, as a positive outlook on the company’s future growth does not seem to be supported by current financial performance. It may be prudent for investors to review the company’s past and future performance before investing in APPLIED MATERIALS.
Related Posts


Recent Posts


