ALIBABA GROUP Reports 128.3% Year-Over-Year Revenue Increase of CNY 46.9 Billion for Q4 2022
April 1, 2023

Earnings Overview
ALIBABA GROUP ($SEHK:09988) reported total revenue of CNY 46.9 billion for the quarter ending December 31, 2022, representing a year-over-year increase of 128.3%. Net income increased 2.1% year-over-year to CNY 247.8 billion for the same period, reported on February 23, 2023.
Price History
Following the announcement, the stock opened at HK$92.8 and closed at HK$95.2, up by 2.4% from prior closing price of 93.0, indicating an overall positive response from investors. The impressive year-over-year increase in revenue was attributed to strong growth in commerce, cloud and digital media businesses, as well as a rise in subscriber numbers for its digital entertainment platform. The results of ALIBABA GROUP demonstrate its continued success as one of the most successful e-commerce companies in the world. With the promise of continued success, investors are likely to remain bullish on the firm’s stock and prospects going forward. Live Quote…
About the Company
Income Snapshot
Below shows the total revenue, net income and net margin for Alibaba Group. More…
| Total Revenues | Net Income | Net Margin |
| 864.54k | 32.75k | 4.0% |
Cash Flow Snapshot
Below shows the cash from operations, investing and financing for Alibaba Group. More…
| Operations | Investing | Financing |
| 161.31k | -195.95k | -66.91k |
Balance Sheet Snapshot
Below shows the total assets, liabilities and book value per share for Alibaba Group. More…
| Total Assets | Total Liabilities | Book Value Per Share |
| 1.77M | 662.34k | 47.15 |
Key Ratios Snapshot
Some of the financial key ratios for Alibaba Group are shown below. More…
| 3Y Rev Growth | 3Y Operating Profit Growth | Operating Margin |
| 20.9% | 3.5% | 10.1% |
| FCF Margin | ROE | ROA |
| 12.5% | 5.6% | 3.1% |
Analysis
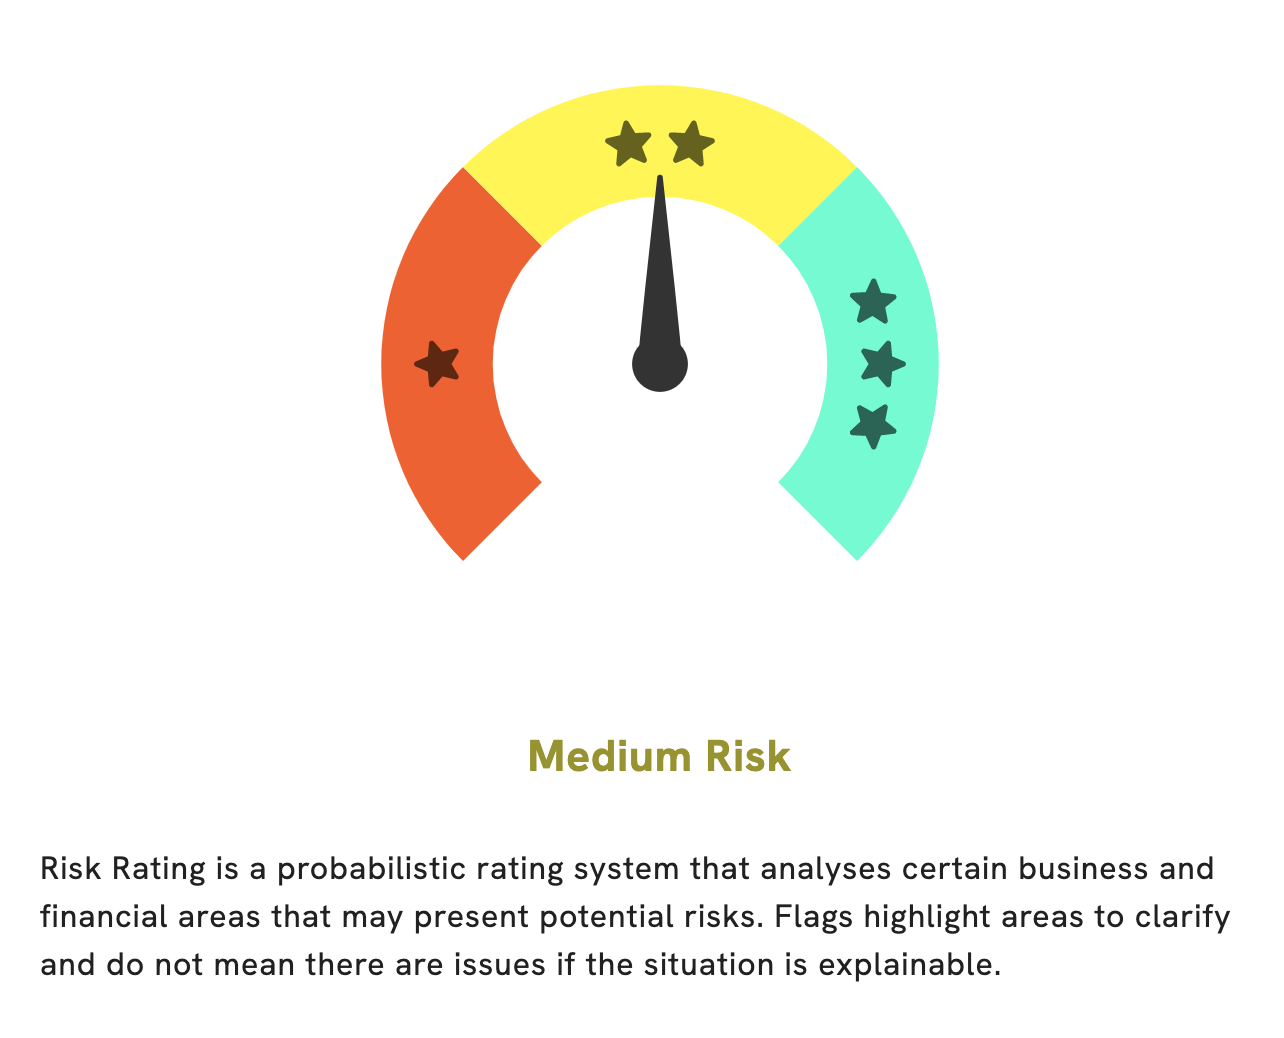
At GoodWhale, we have taken a deep dive into the fundamentals of ALIBABA GROUP to bring you our comprehensive analysis. After a thorough review, we have concluded that ALIBABA GROUP is a medium risk investment with regards to its financial and business aspects. We have also detected two risk warnings in their balance sheets and cashflow statement, which could be an indication of potential issues. We strongly encourage potential investors to register on GoodWhale.com to get a detailed look at the risk warnings and our full analysis. More…
Peers
Founded in 1999, Alibaba’s business interests include e-commerce, retail, Internet, and technology. Alibaba is the world’s largest online and mobile commerce company, with over 654 million active users. Alibaba’s main competitor is JD.com, Inc, followed by Amazon.com, Inc and Pinduoduo, Inc.
– JD.com Inc ($SEHK:09618)
JD.com Inc is a Chinese e-commerce company. The company operates in three segments: JD Mall, JD Logistics, and New Businesses. It offers a selection of authentic products sourced from brands, third-party merchants, and public markets on its online marketplace. The company also provides an online marketplace for sellers to sell their products to customers. In addition, it offers logistics services, including warehousing, transportation, and delivery. The company was founded in 1998 and is headquartered in Beijing, China.
– Amazon.com Inc ($NASDAQ:AMZN)
Amazon.com, Inc. is an American multinational technology company based in Seattle, Washington, that focuses on e-commerce, cloud computing, digital streaming, and artificial intelligence. It is one of the Big Four tech companies, along with Google, Apple, and Facebook. Amazon is the world’s largest online retailer and second-largest technology company by revenue.
As of 2022, Amazon has a market cap of 1.17 trillion dollars and a return on equity of 6.04%. Amazon is a technology and e-commerce powerhouse, and has been a driving force in the growth of these industries. The company has a wide moat and continues to innovate, which has allowed it to maintain its position as a leader in these industries.
– Pinduoduo Inc ($NASDAQ:PDD)
Pinduoduo Inc is a Chinese social commerce platform. The Company connects merchants and consumers through its platform. The Company also offers products in a variety of categories, including apparel, home and garden, electronics, food and grocery, and baby, children and toys, among others. Pinduoduo Inc is based in Shanghai, China.
Summary
ALIBABA GROUP released its earnings report for the three months ending December 31, 2022, showing total revenue of CNY 46.9 billion, a year-over-year increase of 128.3%. Net income also increased by 2.1% from the previous year to CNY 247.8 billion. This is a positive sign for potential investors, indicating that the company is continuing to grow and expand its profits. Analyzing these results, it is clear that ALIBABA GROUP remains a sound investment for future growth and profitability.
Related Posts


Recent Posts


