PERRIGO COMPANY Reports Total Revenue of USD 1123.8 Million in Q3 FY2023, Up 2.1% from Prior Year
November 21, 2023

🌥️Earnings Overview
At the end of fiscal year 2023’s third quarter, on September 30, 2023, PERRIGO COMPANY ($NYSE:PRGO) reported total revenue of USD 1123.8 million, representing a 2.1% increase compared to the same period in the preceding year. The company also saw a significant gain in their net income of 128.7%, rising to USD 14.2 million year over year.
Analysis
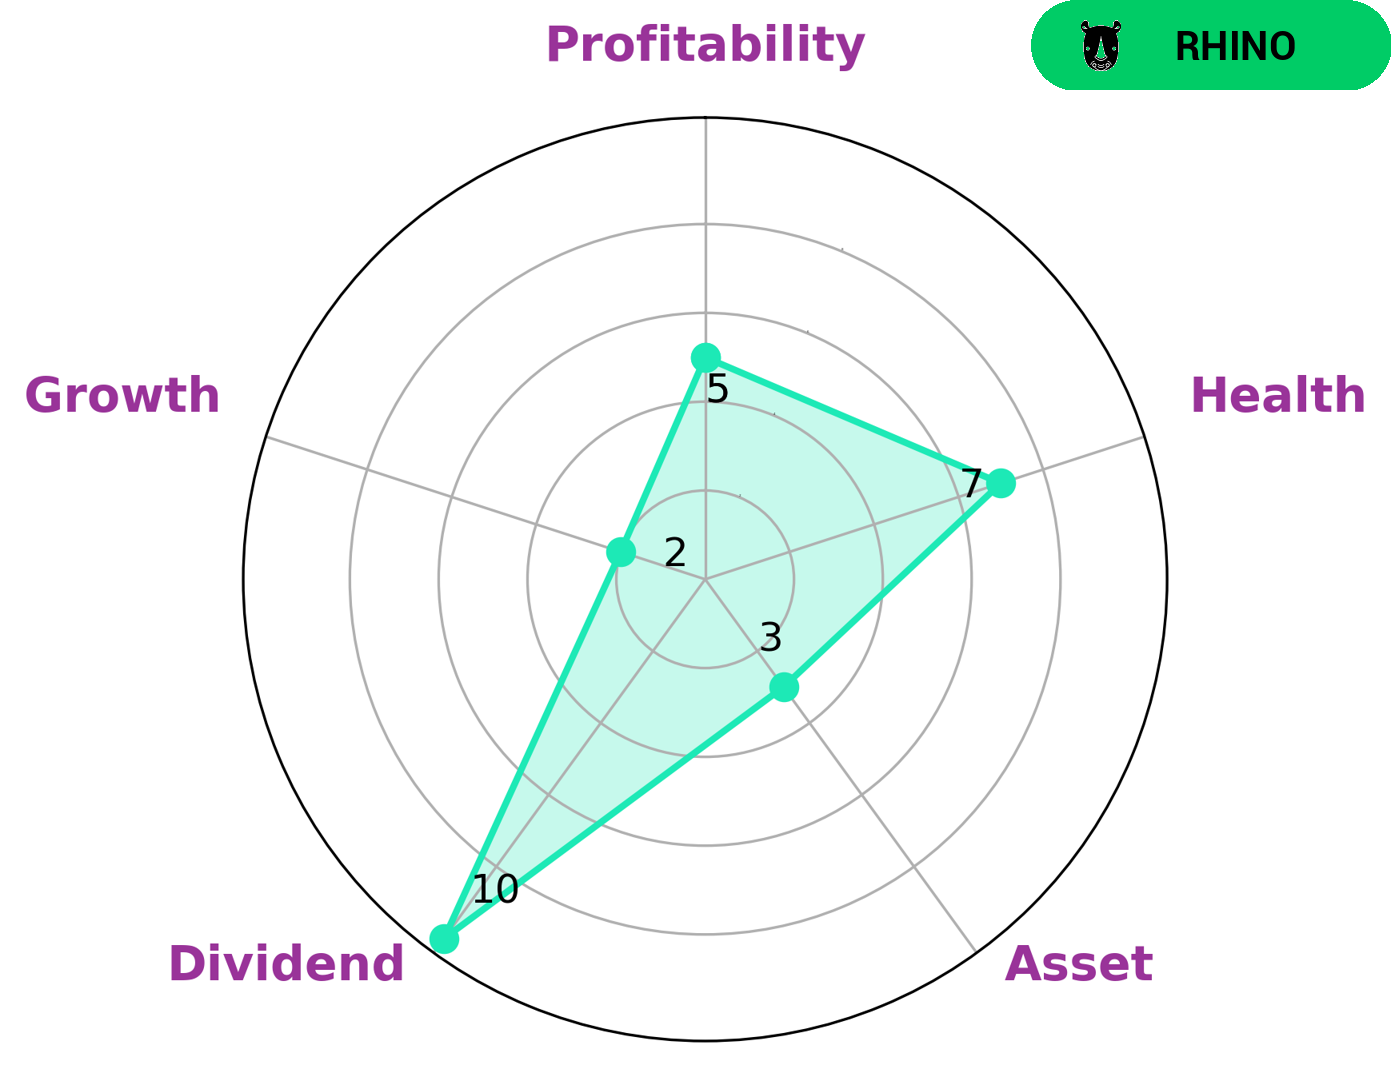
GoodWhale has conducted an analysis of PERRIGO COMPANY‘s wellbeing. According to Star Chart, the company is strong in dividend, medium in profitability and weak in asset growth. The company boasts a high health score of 8/10, indicating the company’s ability to pay off debt and fund future operations through its cashflows and debt. PERRIGO COMPANY is classified as ‘rhino’, meaning it has achieved moderate revenue or earnings growth. This type of company may be of interest to investors who are looking for moderate, but consistent growth. They may also be interested in a company that has strong dividend capabilities, as well as financial stability – something PERRIGO COMPANY offers with its high health score. Investors who are looking for a company offering stability and consistency may be attracted to PERRIGO COMPANY. More…
About the Company
Income Snapshot
Below shows the total revenue, net income and net margin for Perrigo Company. More…
| Total Revenues | Net Income | Net Margin |
| 4.65k | -4.1 | 0.8% |
Cash Flow Snapshot
Below shows the cash from operations, investing and financing for Perrigo Company. More…
| Operations | Investing | Financing |
| 382.7 | -80.7 | -185.1 |
Balance Sheet Snapshot
Below shows the total assets, liabilities and book value per share for Perrigo Company. More…
| Total Assets | Total Liabilities | Book Value Per Share |
| 10.76k | 6.02k | 34.97 |
Key Ratios Snapshot
Some of the financial key ratios for Perrigo Company are shown below. More…
| 3Y Rev Growth | 3Y Operating Profit Growth | Operating Margin |
| -3.0% | -22.6% | 4.4% |
| FCF Margin | ROE | ROA |
| 6.0% | 2.7% | 1.2% |
Peers
Yuhan Corp, JW Pharmaceutical and Lavipharm SA are all competitors of Perrigo Co PLC.
– Yuhan Corp ($KOSE:000105)
Yuhan Corp is a South Korean conglomerate that operates in the pharmaceutical and chemical industries. It has a market cap of 3.83T as of 2022 and a Return on Equity of 4.29%. The company was founded in 1926 and is headquartered in Seoul. It is one of the largest companies in South Korea and is a major player in the global pharmaceutical market.
– JW Pharmaceutical ($KOSE:001060)
As of 2022, JW Pharmaceutical has a market cap of 396.36B and a Return on Equity of 13.04%. The company is a global pharmaceutical company that develops, manufactures, and markets prescription and over-the-counter medicines.
Summary
PERRIGO COMPANY had a strong third quarter of fiscal year 2023, with total revenue increasing by 2.1% to USD 1123.8 million and net income increasing by 128.7% to USD 14.2 million. This impressive performance was reflected in the company’s stock price, which moved up the same day. The figures suggest that PERRIGO COMPANY is a solid investment option, especially with such a strong financial performance despite the current challenging economic conditions. Investors should keep a close eye on the company as it continues to deliver strong returns.
Related Posts


Recent Posts


