JOHNSON & JOHNSON Reports Stagnant Revenue in Q2 FY2023
August 29, 2023

🌥️Earnings Overview
JOHNSON & JOHNSON ($NYSE:JNJ) reported that, for the second quarter of FY2023 (ending June 30 2023), total revenue was USD 25.5 billion, equal to the same period of the previous year. Net income for the quarter also remained unchanged, standing at USD 5.1 billion year-over-year. The results were announced on July 31 2023.
Market Price
On Monday, JOHNSON & JOHNSON reported that overall revenue was stagnant for the second quarter of fiscal year 2023. The company’s stock opened at $169.7 and closed at $167.5, down by 4.0% from the prior closing price of 174.5. This stagnant growth in revenue resulted in a disappointing performance for JOHNSON & JOHNSON and its investors. Although the company was expecting a slight growth in revenue due to new product launches and increased investment, JOHNSON & JOHNSON failed to meet the expectations set forth in its quarterly report.
As a result, the company’s stock was impacted negatively and the overall sentiment of investors was low. This could be done through expanding into new markets, focusing on customer retention, or acquiring smaller competitors in order to strengthen their position in the industry. The company must now focus on innovation and strategic investments to drive future growth and create value for shareholders. Live Quote…
About the Company
Income Snapshot
Below shows the total revenue, net income and net margin for JNJ. More…
| Total Revenues | Net Income | Net Margin |
| 97.77k | 13.05k | 12.5% |
Cash Flow Snapshot
Below shows the cash from operations, investing and financing for JNJ. More…
| Operations | Investing | Financing |
| 23.42k | -6.19k | -18.02k |
Balance Sheet Snapshot
Below shows the total assets, liabilities and book value per share for JNJ. More…
| Total Assets | Total Liabilities | Book Value Per Share |
| 179.23k | 108.96k | 27.04 |
Key Ratios Snapshot
Some of the financial key ratios for JNJ are shown below. More…
| 3Y Rev Growth | 3Y Operating Profit Growth | Operating Margin |
| 6.7% | 6.9% | 24.3% |
| FCF Margin | ROE | ROA |
| 24.3% | 21.1% | 8.3% |
Analysis
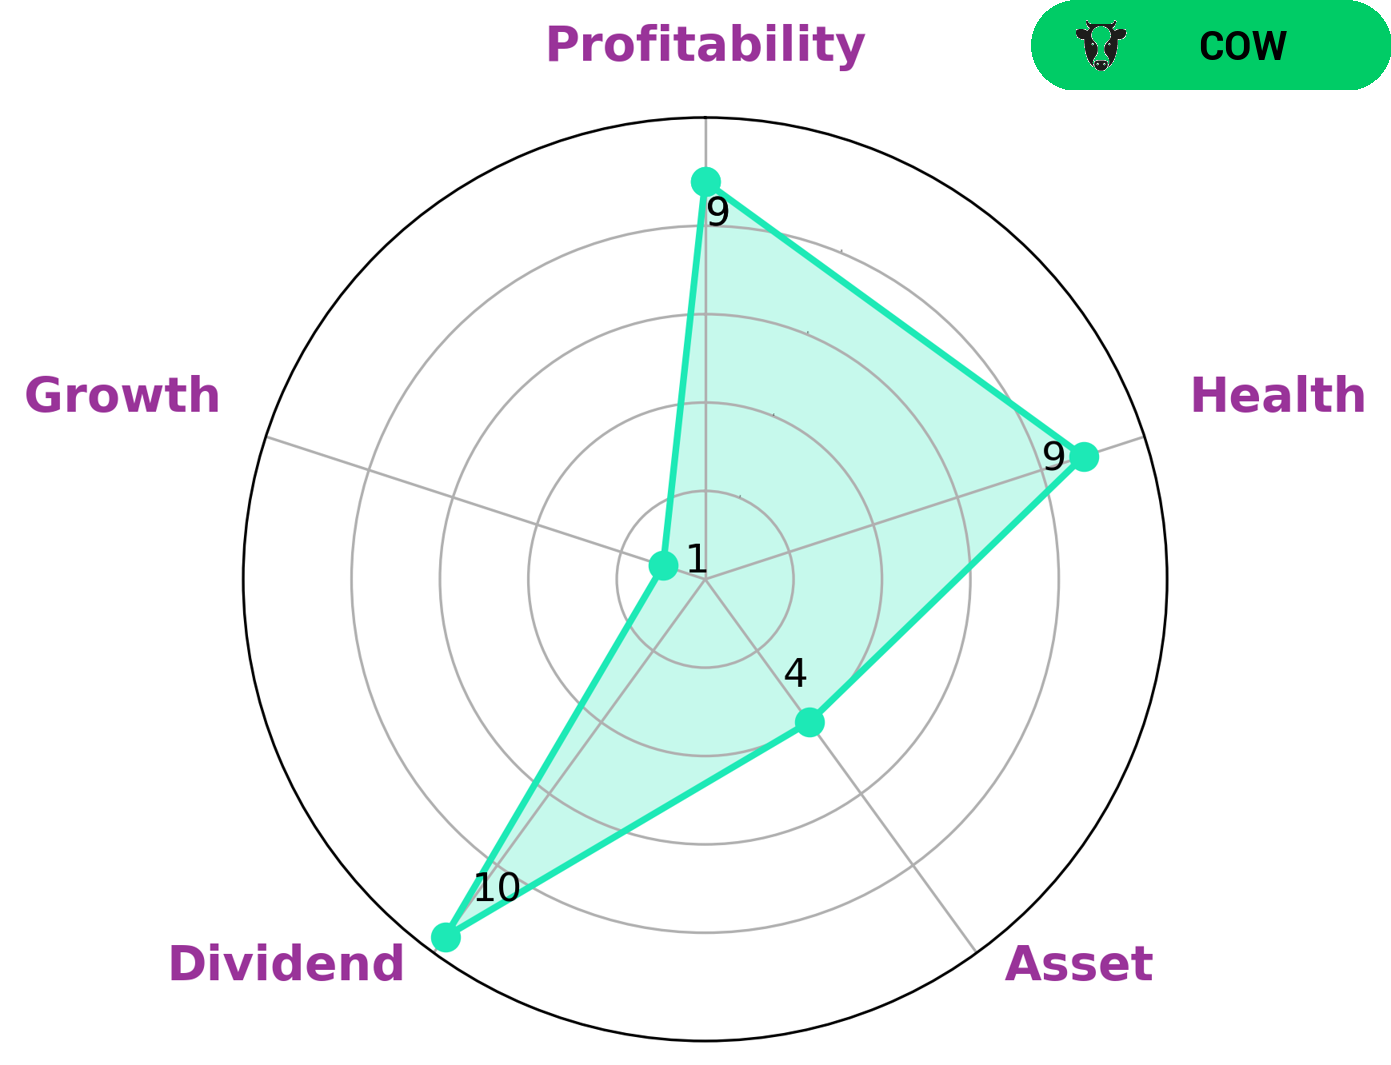
GoodWhale recently conducted an analysis of JOHNSON & JOHNSON’s wellbeing. From the Star Chart, it is classified as a ‘cow’, which is a type of company that pays out consistent and sustainable dividends. This means that JOHNSON & JOHNSON would be a great option for investors who are looking for steady dividend income. Apart from its dividend performance, GoodWhale has also assessed other aspects of JOHNSON & JOHNSON’s financial health. Overall, it has received a high health score of 8/10. This indicates that JOHNSON & JOHNSON is capable to safely ride out any crisis without the risk of bankruptcy. In particular, it performs well in dividend, profitability and weak in asset and growth. This makes JOHNSON & JOHNSON a great option for investors who are looking for a steady and reliable investment. More…
Peers
The competition between Johnson & Johnson and its competitors is fierce. AstraZeneca PLC, Pfizer Inc, and BioNTech SE are all major players in the pharmaceutical industry, and they are all vying for a piece of the pie. Johnson & Johnson is a well-established company with a long history of success, but its competitors are not to be underestimated. They are all large, well-funded companies with a lot to lose if they don’t win the competition.
– AstraZeneca PLC ($LSE:AZN)
AstraZeneca PLC is a biopharmaceutical company with a market cap of 152.13B as of 2022. The company focuses on the discovery, development, and commercialization of small molecule drugs in the areas of oncology, cardiovascular, and renal & metabolism. The company’s ROE for the year ended December 31, 2020 was -0.94%.
– Pfizer Inc ($NYSE:PFE)
Pfizer Inc is a pharmaceutical company with a market cap of 240.55B as of 2022. The company has a return on equity of 24.63%. Pfizer Inc is a research-based, global pharmaceutical company that discovers, develops, manufactures, and markets medicines for humans and animals. The company’s products include prescription and over-the-counter medicines, vaccines, and biologic therapies.
– BioNTech SE ($NASDAQ:BNTX)
BioNTech SE is a German biotech company founded in 2008 that focuses on the development of Innovation therapies against cancer and other serious diseases. The company has a market cap of 32.91B as of 2022 and a Return on Equity of 71.82%. BioNTech’s mission is to revolutionize the treatment of cancer and other serious diseases by leveraging the power of the immune system. The company is developing a portfolio of immunotherapy products based on its proprietary mRNA technology platform.
Summary
JOHNSON & JOHNSON reported their earnings results for the second quarter of FY2023 on July 31 2023. Total revenue was unchanged from the previous year at USD 25.5 billion, and net income remained steady at USD 5.1 billion, year-over-year. Although their financial results were in line with expectations, the stock price dropped on the same day.
Investors should consider whether this is a buying opportunity or a sign of worse things to come. Analysts will be watching closely to determine the company’s future prospects.
Related Posts


Recent Posts


