GUARDANT HEALTH Reports 21.8% Year-Over-Year Revenue Increase in Q3 of FY2023, Net Income Decreases -162.0 Million
December 18, 2023

☀️Earnings Overview
For the third quarter of FY2023 ending September 30 2023, GUARDANT HEALTH ($NASDAQ:GH) reported total revenue of USD 143.0 million, a 21.8% year-over-year increase, as well as a net income of -86.1 million, which is a decrease from the previous year of -162.0 million.
Analysis
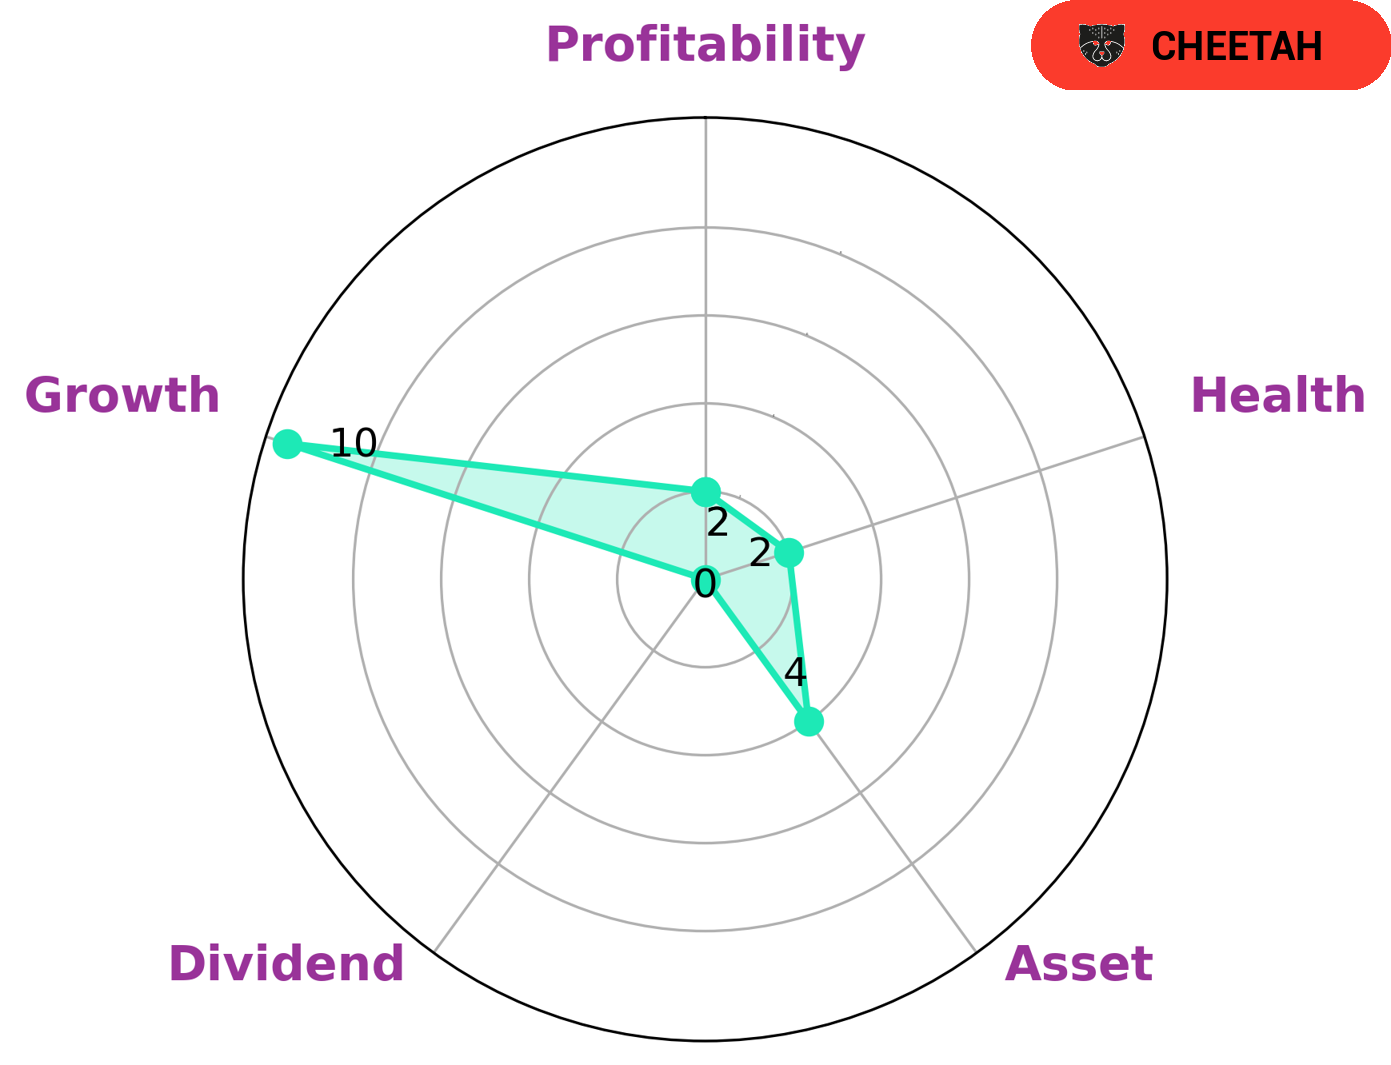
GoodWhale recently conducted an analysis of GUARDANT HEALTH‘s fundamentals. According to the Star Chart, GUARDANT HEALTH is strong in growth, medium in asset and weak in dividend and profitability. Furthermore, GUARDANT HEALTH has a low health score of 3/10 considering its cashflows and debt, making it less likely to pay off debt and fund future operations. This has resulted in GUARDANT HEALTH being classified as a ‘cheetah’, which is a type of company that has achieved high revenue or earnings growth but is considered less stable due to its lower profitability. This type of company may be of interest to investors who are looking for high-growth investments but are willing to take on higher levels of risk. Such investors should be aware that there is a greater chance of losses with higher-risk investments, and that they should be prepared to adjust their portfolios accordingly. Additionally, investors should consider the potential impact of any macro-economic events that could affect the company’s performance. Ultimately, investing in GUARDANT HEALTH requires a careful assessment of the risks and rewards associated with such an investment. More…
About the Company
Income Snapshot
Below shows the total revenue, net income and net margin for Guardant Health. More…
| Total Revenues | Net Income | Net Margin |
| 535.78 | -432.34 | -80.7% |
Cash Flow Snapshot
Below shows the cash from operations, investing and financing for Guardant Health. More…
| Operations | Investing | Financing |
| -337 | 247.42 | 389.12 |
Balance Sheet Snapshot
Below shows the total assets, liabilities and book value per share for Guardant Health. More…
| Total Assets | Total Liabilities | Book Value Per Share |
| 1.8k | 1.57k | 1.93 |
Key Ratios Snapshot
Some of the financial key ratios for Guardant Health are shown below. More…
| 3Y Rev Growth | 3Y Operating Profit Growth | Operating Margin |
| 25.5% | – | -79.9% |
| FCF Margin | ROE | ROA |
| -67.8% | -102.7% | -14.9% |
Peers
The competition in the market for cancer detection and treatment is heating up. Guardant Health Inc, a leading player in the field, is up against some stiff competition from the likes of Aclaris Therapeutics Inc, Inoviq Ltd, and Biomark Diagnostics Inc. All these companies are vying for a share of the pie in this rapidly growing market. While Guardant Health Inc has a strong product portfolio and a good track record, its competitors are not far behind and are also making inroads into this market. It remains to be seen who will emerge victorious in this battle.
– Aclaris Therapeutics Inc ($NASDAQ:ACRS)
Aclaris Therapeutics Inc is a clinical-stage biopharmaceutical company focused on the development and commercialization of drugs for the treatment of dermatological and immuno-inflammatory diseases. The company’s lead product candidates include ATI-502 for the treatment of seborrheic keratosis, and ATI-501 for the treatment of vitiligo. Aclaris Therapeutics Inc has a market cap of 1.11B as of 2022, a Return on Equity of -25.42%.
– Inoviq Ltd ($ASX:IIQ)
Inoviq Ltd is a publicly traded company with a market capitalization of 50.61M as of 2022. The company’s return on equity (ROE) is -13.68%. Inoviq Ltd is engaged in the development and commercialization of innovative drugs and therapies. The company’s products are designed to improve the lives of patients with serious medical conditions. Inoviq’s products are available in more than 60 countries worldwide.
– Biomark Diagnostics Inc ($OTCPK:BMKDF)
Biomark Diagnostics Inc is a company that provides diagnostic testing services. The company has a market capitalization of 10.88 million as of 2022 and a return on equity of 179.57%. The company’s diagnostic testing services include tests for cancer, cardiovascular disease, and infectious diseases. Biomark Diagnostics Inc is headquartered in the United States.
Summary
Investors may be disappointed with the Q3 FY2023 performance of Guardant Health, as the total revenue of USD 143.0 million and a net income of -86.1 million represented a 21.8% year-over-year increase but still a decrease from the previous year of -162.0 million. The stock price also moved down on the same day, which may reflect the market’s concerns about the company’s financials. Investors should further consider the potential risks of investing in Guardant Health before making their decision.
Related Posts


Recent Posts


