STRATASYS LTD Reports 4.1% Decrease in Total Revenue and 58.3% Decrease in Net Income for 2nd Quarter of FY2023
August 16, 2023

🌥️Earnings Overview
For the second quarter of the fiscal year 2023 ending June 30 2023, STRATASYS LTD ($NASDAQ:SSYS) reported a total revenue of USD 159.8 million, a 4.1% decrease from the same period in the previous year, and a net income of USD -38.6 million, a 58.3% decrease year over year.
Analysis
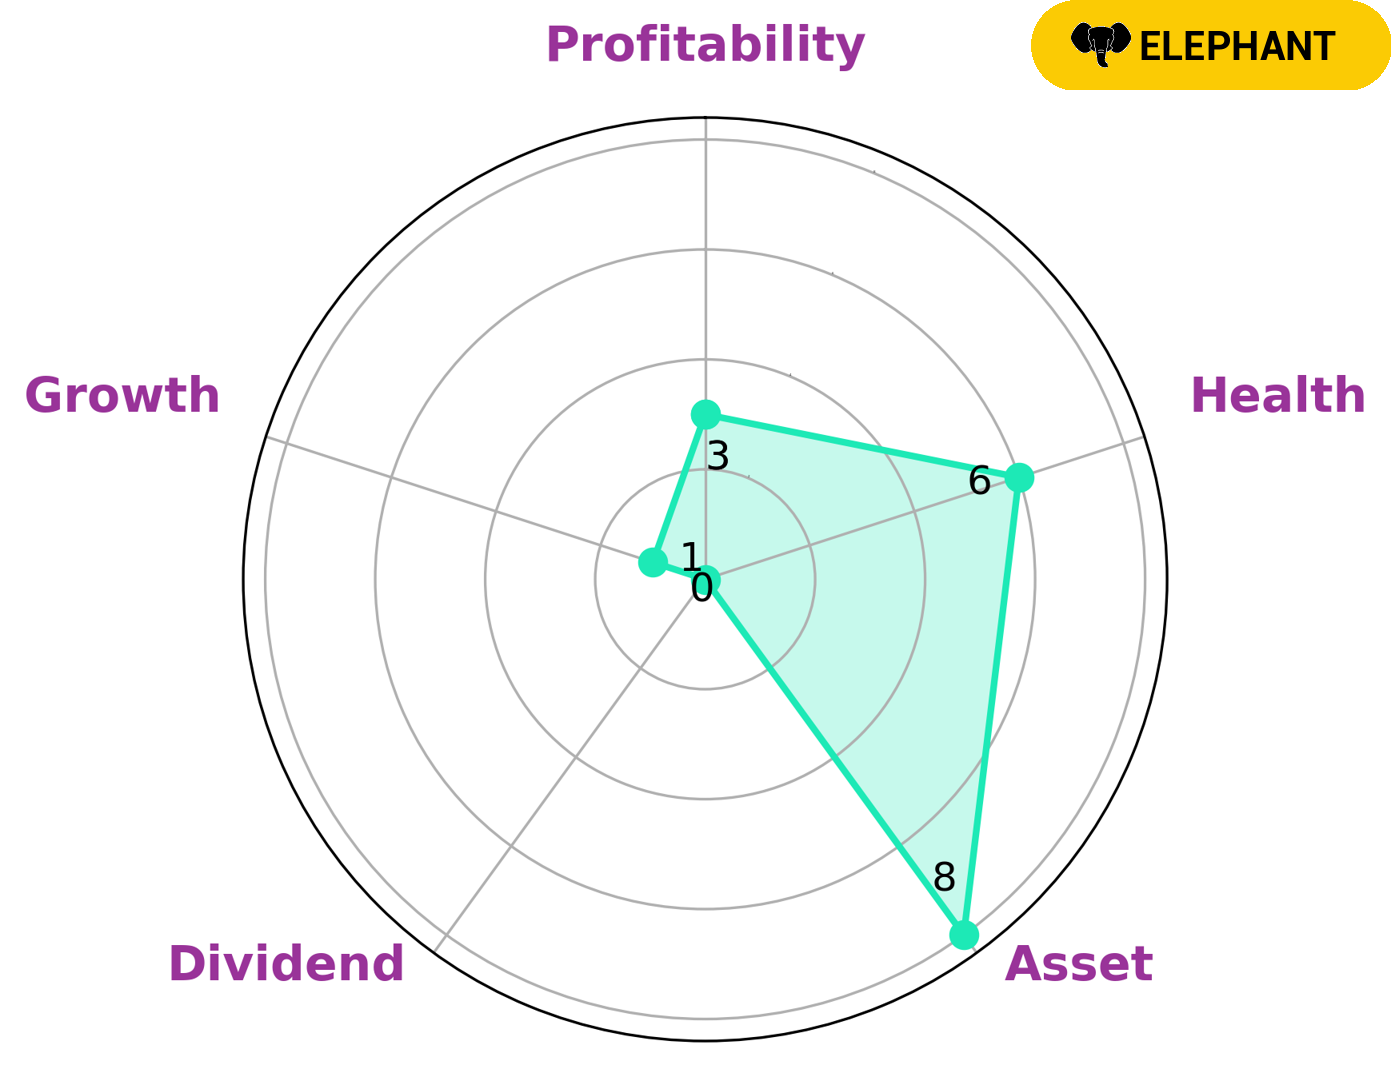
STRATASYS LTD has been evaluated by GoodWhale in order to analyze its wellbeing. GoodWhale’s Star Chart gave STRATASYS LTD an intermediate health score of 6/10, indicating that it is in a decent condition considering its cashflows and debt. STRATASYS LTD is strong in terms of assets, while lacking in terms of dividend, growth, and profitability. Therefore, STRATASYS LTD falls into the ‘elephant’ category of companies with a considerable amount of assets once liabilities are subtracted. Investors who prefer companies with a solid asset base and are not necessarily looking for dividend payments may be interested in investing in STRATASYS LTD. Furthermore, investors with a relatively high risk appetite may consider investing in STRATASYS LTD as its Star Chart score suggests that it is in a relatively stable financial position and is able to pay off debt and fund future operations. More…
About the Company
Income Snapshot
Below shows the total revenue, net income and net margin for Stratasys Ltd. More…
| Total Revenues | Net Income | Net Margin |
| 630.58 | -44.48 | -10.8% |
Cash Flow Snapshot
Below shows the cash from operations, investing and financing for Stratasys Ltd. More…
| Operations | Investing | Financing |
| -77.27 | -7.21 | -2.77 |
Balance Sheet Snapshot
Below shows the total assets, liabilities and book value per share for Stratasys Ltd. More…
| Total Assets | Total Liabilities | Book Value Per Share |
| 1.23k | 307.2 | 13.39 |
Key Ratios Snapshot
Some of the financial key ratios for Stratasys Ltd are shown below. More…
| 3Y Rev Growth | 3Y Operating Profit Growth | Operating Margin |
| 3.5% | – | -10.2% |
| FCF Margin | ROE | ROA |
| -15.4% | -4.3% | -3.3% |
Peers
The company’s products are used in a variety of industries, including aerospace, automotive, healthcare, and consumer products. Stratasys Ltd has a wide range of competitors, including WEP Solutions Ltd, MGI Digital Graphic Technology SA, and HiTi Digital Inc.
– WEP Solutions Ltd ($BSE:532373)
WEP Solutions Ltd is an information technology company that provides a range of services, including software development, enterprise resource planning, and cloud computing. The company has a market cap of 839.61M as of 2022 and a Return on Equity of 6.32%.
– MGI Digital Graphic Technology SA ($OTCPK:FRIIF)
MGI Digital Graphic Technology SA is a Swiss manufacturer of digital printing and finishing solutions for the graphic arts industry. The company has a market capitalization of 184.68 million as of 2022 and a return on equity of 4.79%. MGI Digital Graphic Technology SA designs, manufactures, and markets a range of digital printing and finishing solutions, including printers, print heads, inks, and software. The company’s products are used in a variety of applications, such as signage, packaging, labels, and commercial printing.
– HiTi Digital Inc ($TWSE:3494)
HiTi Digital Inc is a publicly traded company with a market cap of 1B as of 2022. The company has a Return on Equity of -23.92%. HiTi Digital Inc is engaged in the business of digital textile printing, photo printing, and ID card printing.
Summary
STRATASYS LTD reported disappointing second quarter financial results for FY2023, with total revenue of USD 159.8 million, down 4.1% year over year, and net income of USD -38.6 million, down a staggering 58.3%. These results were reflected in the stock price which dropped on the same day. Investors should take into consideration the current market conditions in evaluating STRATASYS LTD’s future performance, as well as current company initiatives and strategies in order to make an informed decision when deciding whether to invest in this company.
Related Posts


Recent Posts


