Y-MABS THERAPEUTICS Records 63.1% Year-Over-Year Revenue Increase in Q3 of 2023
December 4, 2023

☀️Earnings Overview
Y-MABS THERAPEUTICS ($NASDAQ:YMAB) reported a total revenue of USD 20.4 million for the third quarter of fiscal year 2023, ending on September 30, 2023 – representing a 63.1% increase from the comparable period of the prior year. Net income for the quarter was -7.8 million, showing marked improvement from -27.5 million in the same quarter of the prior year.
Analysis
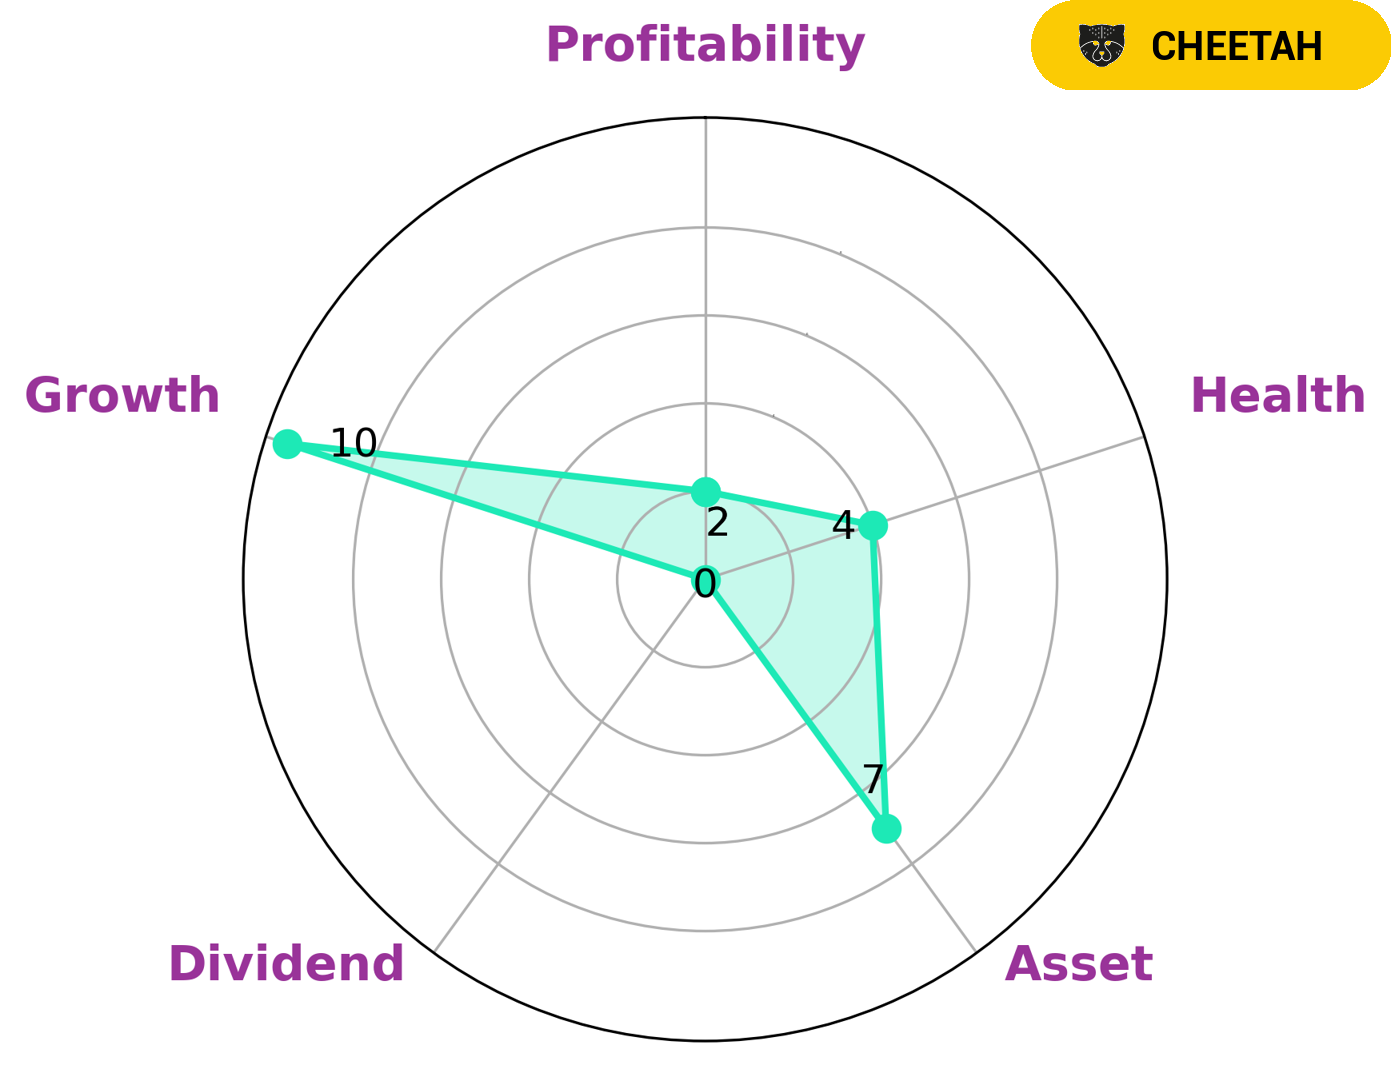
GoodWhale’s analysis of Y-MABS THERAPEUTICS‘ fundamentals has yielded interesting results. According to the Star Chart, Y-MABS THERAPEUTICS is strong in asset and growth, but weak in dividend and profitability. This has led to the classification of Y-MABS THERAPEUTICS as a ‘cheetah’, a type of company with high revenue or earnings growth, yet considered less stable due to lower profitability. This type of company is likely to appeal to investors with a higher risk appetite, who are looking for potential reward that comes with a greater risk. In terms of health, Y-MABS THERAPEUTICS has an intermediate score of 4/10, considering its cashflows and debt, which suggests that the company is likely to sustain future operations in times of crisis. More…
About the Company
Income Snapshot
Below shows the total revenue, net income and net margin for Y-mabs Therapeutics. More…
| Total Revenues | Net Income | Net Margin |
| 92.9 | -19.28 | -20.8% |
Cash Flow Snapshot
Below shows the cash from operations, investing and financing for Y-mabs Therapeutics. More…
| Operations | Investing | Financing |
| -27.86 | 0 | 0 |
Balance Sheet Snapshot
Below shows the total assets, liabilities and book value per share for Y-mabs Therapeutics. More…
| Total Assets | Total Liabilities | Book Value Per Share |
| 128.88 | 28.73 | 2.3 |
Key Ratios Snapshot
Some of the financial key ratios for Y-mabs Therapeutics are shown below. More…
| 3Y Rev Growth | 3Y Operating Profit Growth | Operating Margin |
| 0.0% | – | -25.4% |
| FCF Margin | ROE | ROA |
| -30.0% | -14.4% | -11.5% |
Peers
The company’s lead product candidate, naxitamab, is in clinical development for the treatment of neuroblastoma, a rare and aggressive pediatric cancer. Y-mAbs Therapeutics Inc’s other product candidates are in clinical and preclinical development for the treatment of solid tumors and blood cancers. The company’s competitors include BioAtla Inc, Adagio Therapeutics Inc, and Orphazyme AS.
– BioAtla Inc ($NASDAQ:BCAB)
BioAtla Inc is a clinical-stage biopharmaceutical company that focuses on the discovery, development, and commercialization of immuno-oncology agents. The company’s market cap as of 2022 is 357.65M and its ROE is -41.59%. BioAtla’s main competitors are Bluebird bio, Inc. (NASDAQ: BLUE) and Celgene Corporation (NASDAQ: CELG).
– Adagio Therapeutics Inc ($NASDAQ:ADGI)
Orphazyme AS is a biotech company that focuses on developing treatments for rare diseases. The company has a market cap of 5.88M as of 2022 and a Return on Equity of -845.21%. Despite its negative ROE, Orphazyme AS’s market cap indicates that investors are confident in the company’s future prospects. This is likely due to the fact that Orphazyme AS is working on developing treatments for rare diseases, which is a highly lucrative market.
Summary
Y-MABS Therapeutics‘ third quarter fiscal year 2023 results show total revenue of USD 20.4 million, a 63.1% increase from the same period of the prior year. Although the net income of -7.8 million shows an improvement compared to -27.5 million of the prior year, the stock price still decreased the same day. Investors should be aware that despite the revenue growth, Y-MABS Therapeutics is running at a loss and consider factors such as the trajectory of revenue growth and potential for further losses when making their investing decisions.
Related Posts


Recent Posts


