PROQR Therapeutics N.V Reports 46.3% Decrease in Revenue for Q1 FY2023.
May 28, 2023

Earnings Overview
On May 16th, 2023, PROQR THERAPEUTICS N.V ($NASDAQ:PRQR). reported their earnings for the first quarter of Fiscal Year 2023, ending March 31st, with total revenue of EUR 0.7 million, a 46.3% decrease from the same period the previous year. Net income was EUR -8.9 million, down from the EUR -14.4 million reported in the corresponding quarter of the prior year.
Analysis
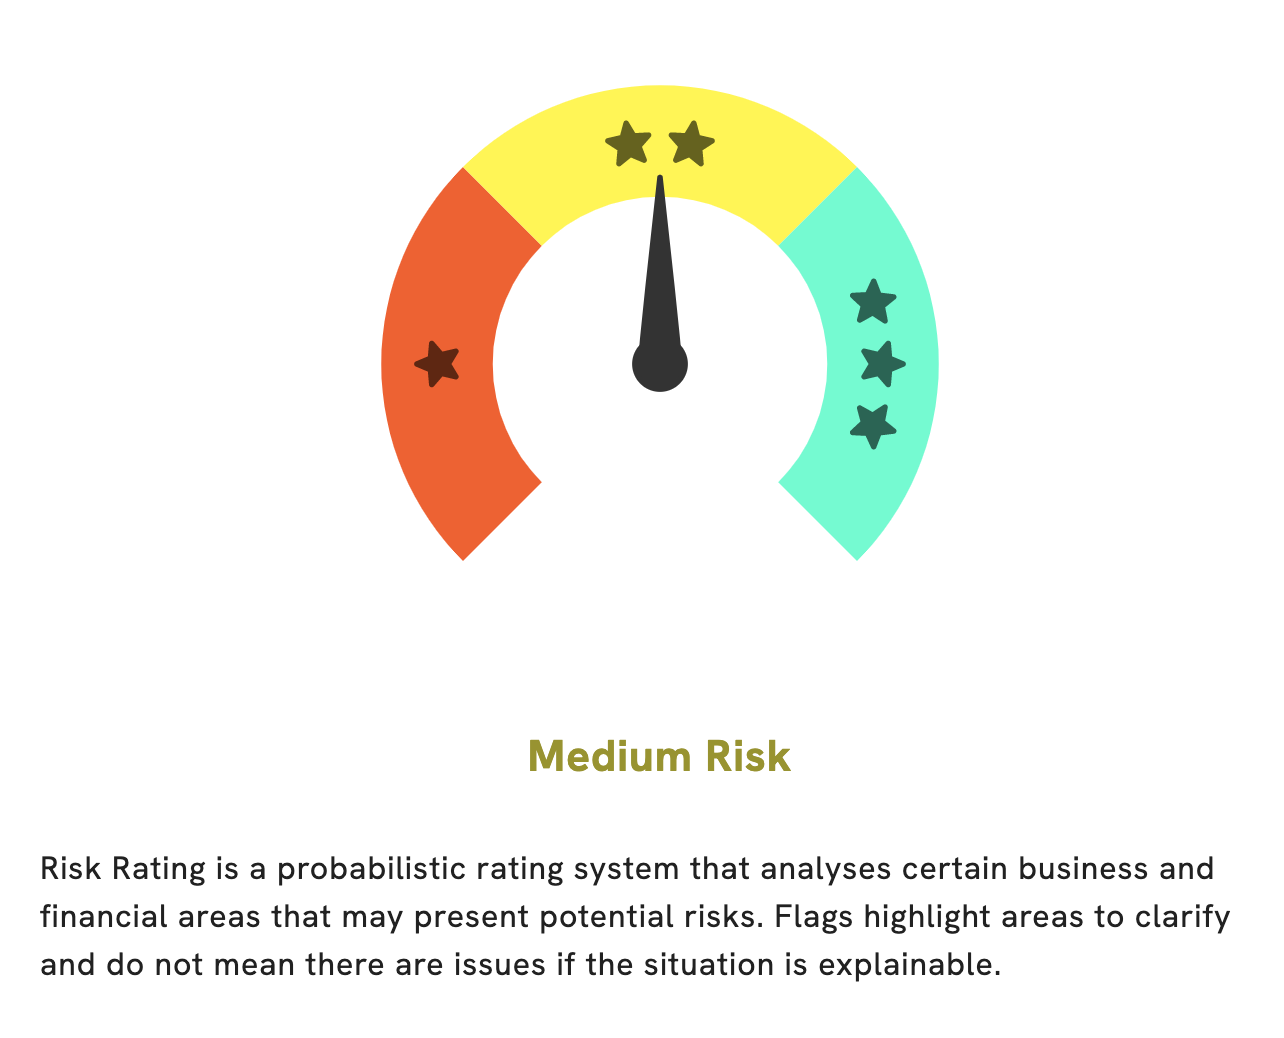
GoodWhale is a great tool to analyze the financials of PROQR THERAPEUTICS N.V. According to GoodWhale’s Risk Rating, PROQR THERAPEUTICS N.V is a medium risk investment in terms of financial and business aspects. This means that investors may face some risks, but may also reap potential rewards from investing in this company. GoodWhale has detected 3 risk warnings in income sheet, balance sheet, cashflow statement. To get a closer look at these risk warnings, one must register with GoodWhale. Through this, one can get a better understanding of the risks associated with investing in PROQR THERAPEUTICS N.V. and determine if investing is the right decision for them. More…
About the Company
Income Snapshot
Below shows the total revenue, net income and net margin for PRQR. More…
| Total Revenues | Net Income | Net Margin |
| 3.56 | -59.94 | -1727.2% |
Cash Flow Snapshot
Below shows the cash from operations, investing and financing for PRQR. More…
| Operations | Investing | Financing |
| -3.32 | -0.55 | -30.61 |
Balance Sheet Snapshot
Below shows the total assets, liabilities and book value per share for PRQR. More…
| Total Assets | Total Liabilities | Book Value Per Share |
| 158.01 | 99.31 | 0.73 |
Key Ratios Snapshot
Some of the financial key ratios for PRQR are shown below. More…
| 3Y Rev Growth | 3Y Operating Profit Growth | Operating Margin |
| 0.0% | – | -1460.2% |
| FCF Margin | ROE | ROA |
| -109.9% | -52.2% | -20.6% |
Peers
It is among the leading firms in the industry and is competing with other companies such as Merus NV, Aileron Therapeutics Inc, and Vera Therapeutics Inc to develop groundbreaking therapies for patients worldwide.
– Merus NV ($NASDAQ:MRUS)
Merus NV is a biotechnology company based in the Netherlands. Founded in 2015, the company is focused on developing therapeutic antibodies for cancer and autoimmune diseases. Merus NV has a market cap of 1.03B as of 2023 and a Return on Equity (ROE) of -45.66%. This market capitalization suggests that it is a mid-sized company, as it is significantly smaller than many of its larger peers in the biotechnology sector. The company’s Return on Equity, however, is not impressive, coming in at -45.66%. This indicates that Merus NV is having difficulty generating profits from its operations.
– Aileron Therapeutics Inc ($NASDAQ:ALRN)
Aileron Therapeutics Inc is a biopharmaceutical company focused on developing novel therapies that modulate and restore healthy cellular aging processes. Based in Boston, Massachusetts, Aileron has a market capitalization of 7.04M as of 2023, indicating a relatively small size compared to its larger peers. It also shows a negative return on equity of -88.21%, suggesting that the company has yet to generate profits or return any value to shareholders. Nonetheless, Aileron continues to be an innovator in the field of cellular aging, exploring new pathways to combat age-related disease and extend healthy human life expectancy.
– Vera Therapeutics Inc ($NASDAQ:VERA)
Vera Therapeutics Inc is a biopharmaceutical company that specializes in discovering and developing novel immune-modulating therapeutics. Currently, the company has a market capitalization of 336.83 million as of 2023. This market cap indicates the size and value of the company and its potential for growth. Additionally, Vera Therapeutics Inc has a Return on Equity (ROE) of -53.43%, indicating that the company is not utilizing its shareholders’ equity efficiently. Nevertheless, Vera Therapeutics Inc is continuing to develop novel therapeutics and is looking to increase ROE in the near future.
Summary
PROQR THERAPEUTICS N.V reported their first quarter earnings for FY2023 on May 16 2023, with total revenue of EUR 0.7 million, a decrease of 46.3% from the same period in the previous year. Net income was EUR -8.9 million, lower than the EUR -14.4 million reported in the same quarter of the previous year. The earnings report and subsequent stock price dip suggests that investors should exercise caution when considering investing in PROQR THERAPEUTICS N.V. As the company has seen negative financial performance, investors should review the company’s strategic plans and financial position before investing in order to understand the risks and potential returns associated with such an investment.
Related Posts


Recent Posts


