VICOM LTD Reports SGD 54.6 Million in Revenue and SGD 13.9 Million in Net Income for FY2023 Q2
August 18, 2023

🌥️Earnings Overview
On August 11 2023, VICOM LTD ($SGX:WJP) reported an increase in revenue and net income of 4.6% and 6.3%, respectively, from the quarter ending June 30 2023 to SGD 54.6 million and SGD 13.9 million, respectively, for FY2023 Q2.
Price History
In response to this news, VICOM’s stock opened at SG$1.7 and closed at the same price, representing a decrease of 1.8% from the previous closing price of 1.7. This news comes as a relief for investors, as VICOM LTD has seen their stock prices fall over the past few months. These results show that the company is continuing to remain competitive in the market and grow their revenue. Looking forward, VICOM LTD is optimistic about their prospects for the rest of FY2023. With more digital transformation projects underway, they are confident that they will be able to further increase both their revenue and profits.
In addition, the company plans to invest heavily in new technologies and products to ensure their long-term success. Live Quote…
About the Company
Income Snapshot
Below shows the total revenue, net income and net margin for Vicom Ltd. More…
| Total Revenues | Net Income | Net Margin |
| 108.46 | 27.01 | 24.9% |
Cash Flow Snapshot
Below shows the cash from operations, investing and financing for Vicom Ltd. More…
| Operations | Investing | Financing |
| 24.36 | -9.85 | -30.12 |
Balance Sheet Snapshot
Below shows the total assets, liabilities and book value per share for Vicom Ltd. More…
| Total Assets | Total Liabilities | Book Value Per Share |
| 187.93 | 59.63 | 0.36 |
Key Ratios Snapshot
Some of the financial key ratios for Vicom Ltd are shown below. More…
| 3Y Rev Growth | 3Y Operating Profit Growth | Operating Margin |
| 6.6% | 5.4% | 31.6% |
| FCF Margin | ROE | ROA |
| 14.2% | 17.1% | 11.4% |
Analysis
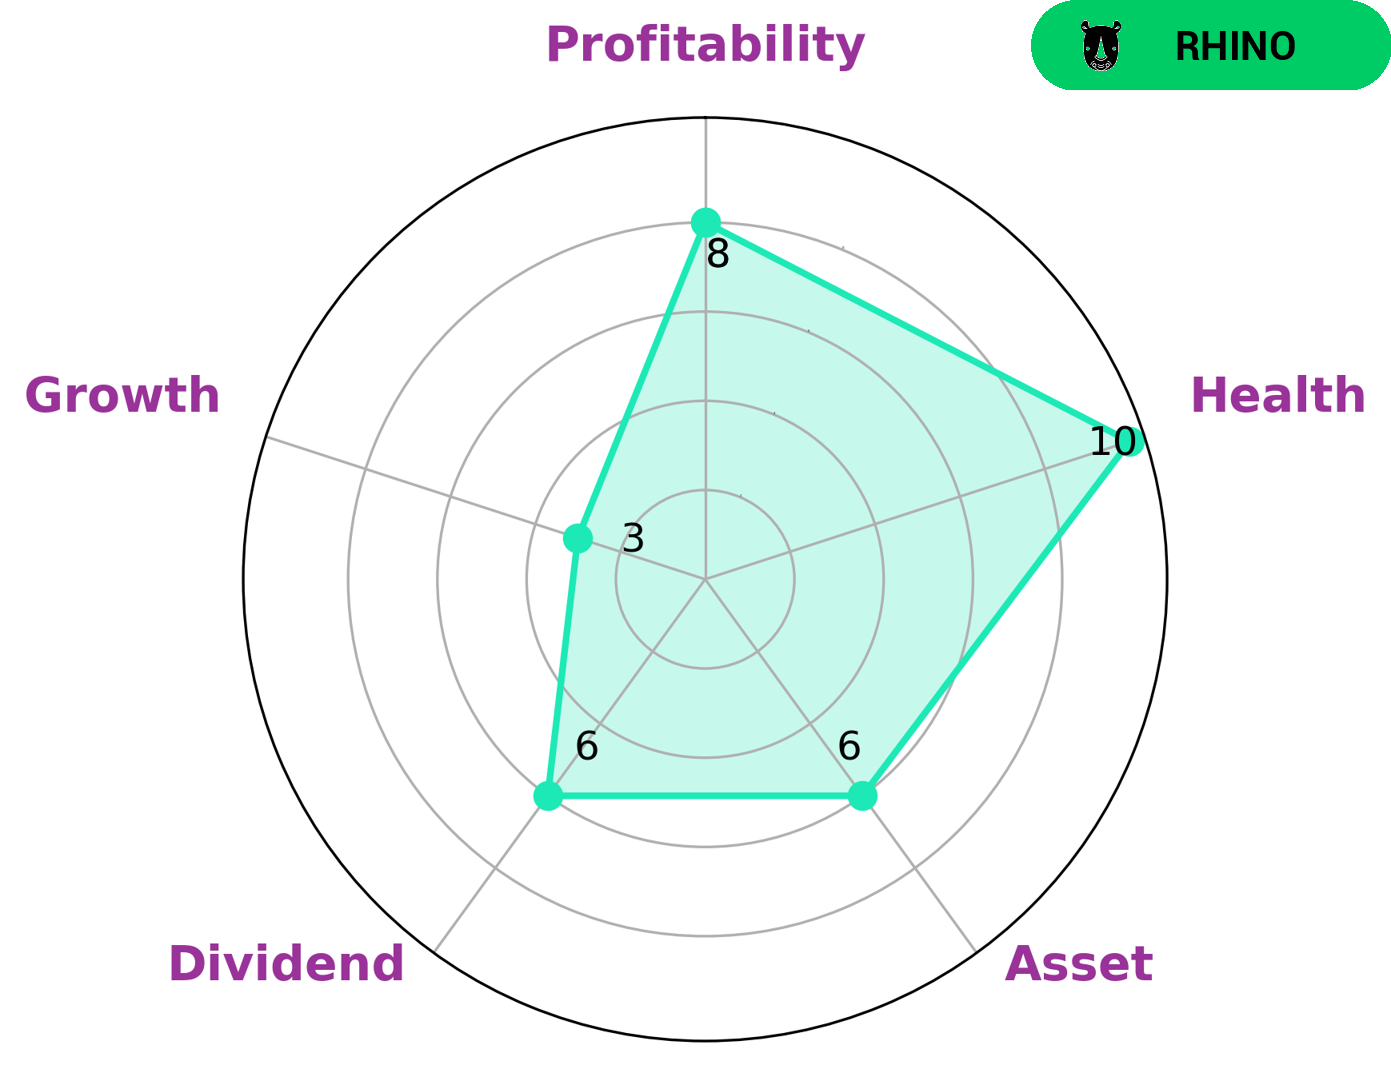
At GoodWhale, we conducted an analysis of VICOM LTD‘s fundamentals. According to our findings using the Star Chart, VICOM LTD is strong in profitability, has medium performance in terms of asset, dividend and growth. In terms of health score, VICOM LTD scored a 10/10, which indicates its capability to pay off debt and fund future operations. Based on our analysis, we concluded that VICOM LTD is a ‘rhino’, a type of company that has achieved moderate revenue or earnings growth. Investors who are interested in such type of company may be looking for companies with steady performance over time, rather than companies with high growth potential. For such investors, a ‘rhino’ company like VICOM LTD offers a good opportunity to invest in a company with established fundamentals and steady returns over time. More…
Peers
It faces competition from Speedemissions Inc, Guan Chao Holdings Ltd, and Centenary United Holdings Ltd, all of whom are also key players in the automotive industry in the region.
– Speedemissions Inc ($OTCPK:SPMI)
Speedemissions Inc is a vehicle emissions testing company that operates in the United States. As of 2022, the company has a market capitalization of 213.06k. This market cap reflects the value of the company’s shares and the amount investors are willing to pay for them. In terms of return on equity, Speedemissions Inc has a negative number of -2.23%. This indicates that the company is not generating enough profit to cover its investors’ investments.
– Guan Chao Holdings Ltd ($SEHK:01872)
Guan Chao Holdings Ltd is an investment holding company that specializes in providing business solutions to its clients. The company operates in a wide range of industries, including real estate, retail, and hospitality. With a market cap of 116.1M, the company is well-positioned to continue expanding its business operations. Its Return on Equity (ROE) of 9.43% indicates that the company is generating a good return on its investments. The company’s strong financial performance is also reflected in its high dividend yield of 5.6%. This demonstrates the company’s commitment to rewarding its shareholders for their support.
– Centenary United Holdings Ltd ($SEHK:01959)
Centenary United Holdings Ltd is a Hong Kong-based conglomerate that engages in a variety of activities, including investments in real estate properties, securities, and futures. As of 2022, the company has a market cap of 156.61M, reflecting its size and presence in the market. Additionally, the company has a Return on Equity (ROE) of 5.62%, which indicates its ability to generate profits relative to its equity base. This is a sign of its financial health and successful management.
Summary
VICOM Ltd recently reported its financial performance for Q2 FY2023, ending June 30 2023. The revenue grew by 4.6% year-over-year to SGD 54.6 million, while the net income rose 6.3% to SGD 13.9 million from the same period last year. This performance indicates that VICOM Ltd is in a healthy financial state and is positioned for sustained growth, making it an attractive investment prospect. Investors should take note of VICOM Ltd’s steady performance over the last quarter, as well as its potential for future growth.
Related Posts


Recent Posts


