General Motors Reports Profits for Q2 of Fiscal Year 2023
August 19, 2023

☀️Earnings Overview
General Motors ($NYSE:GM) announced total revenue of USD 44.8 billion and net income of USD 2.6 billion for the second quarter of 2023, ending June 30, 2023. This was a 25.1% increase in revenue and 52.1% increase in net income compared to the same quarter the year prior.
Share Price
On Tuesday, General Motors released its quarterly financial results for the second quarter of the 2023 fiscal year. In response to the results, General Motors’ stock opened at $37.7 and closed at $37.9, down by 3.5% from its prior closing price of $39.3. The stock has seen a steady decline since its peak in March of this year, but the company’s strong performance in Q2 has given investors hope that the company will continue to generate profits in the upcoming quarters. General Motors attributed its success in Q2 to several factors, including increased sales, higher gross margins, and cost cutting initiatives. The company also benefited from a stronger U.S. economy, which has led to a higher demand for cars and trucks.
In addition to its strong financial performance, General Motors also announced plans to launch new electric vehicles in the near future. This move has been praised by investors and analysts alike, as it signals the company’s commitment to meeting the growing demand for eco-friendly cars and vehicles. Overall, General Motors reported strong profits for the second quarter of the 2023 fiscal year, and investors are hopeful that the company will continue to perform well in the upcoming quarters. With its plans to launch new electric vehicles, General Motors is poised to take advantage of the growing demand for eco-friendly cars and trucks in the near future. Live Quote…
About the Company
Income Snapshot
Below shows the total revenue, net income and net margin for General Motors. More…
| Total Revenues | Net Income | Net Margin |
| 169.73k | 10.17k | 6.2% |
Cash Flow Snapshot
Below shows the cash from operations, investing and financing for General Motors. More…
| Operations | Investing | Financing |
| 21.49k | -16.48k | 1.99k |
Balance Sheet Snapshot
Below shows the total assets, liabilities and book value per share for General Motors. More…
| Total Assets | Total Liabilities | Book Value Per Share |
| 275.83k | 199.86k | 51.18 |
Key Ratios Snapshot
Some of the financial key ratios for General Motors are shown below. More…
| 3Y Rev Growth | 3Y Operating Profit Growth | Operating Margin |
| 13.6% | 112.0% | 7.9% |
| FCF Margin | ROE | ROA |
| -0.7% | 11.9% | 3.1% |
Analysis
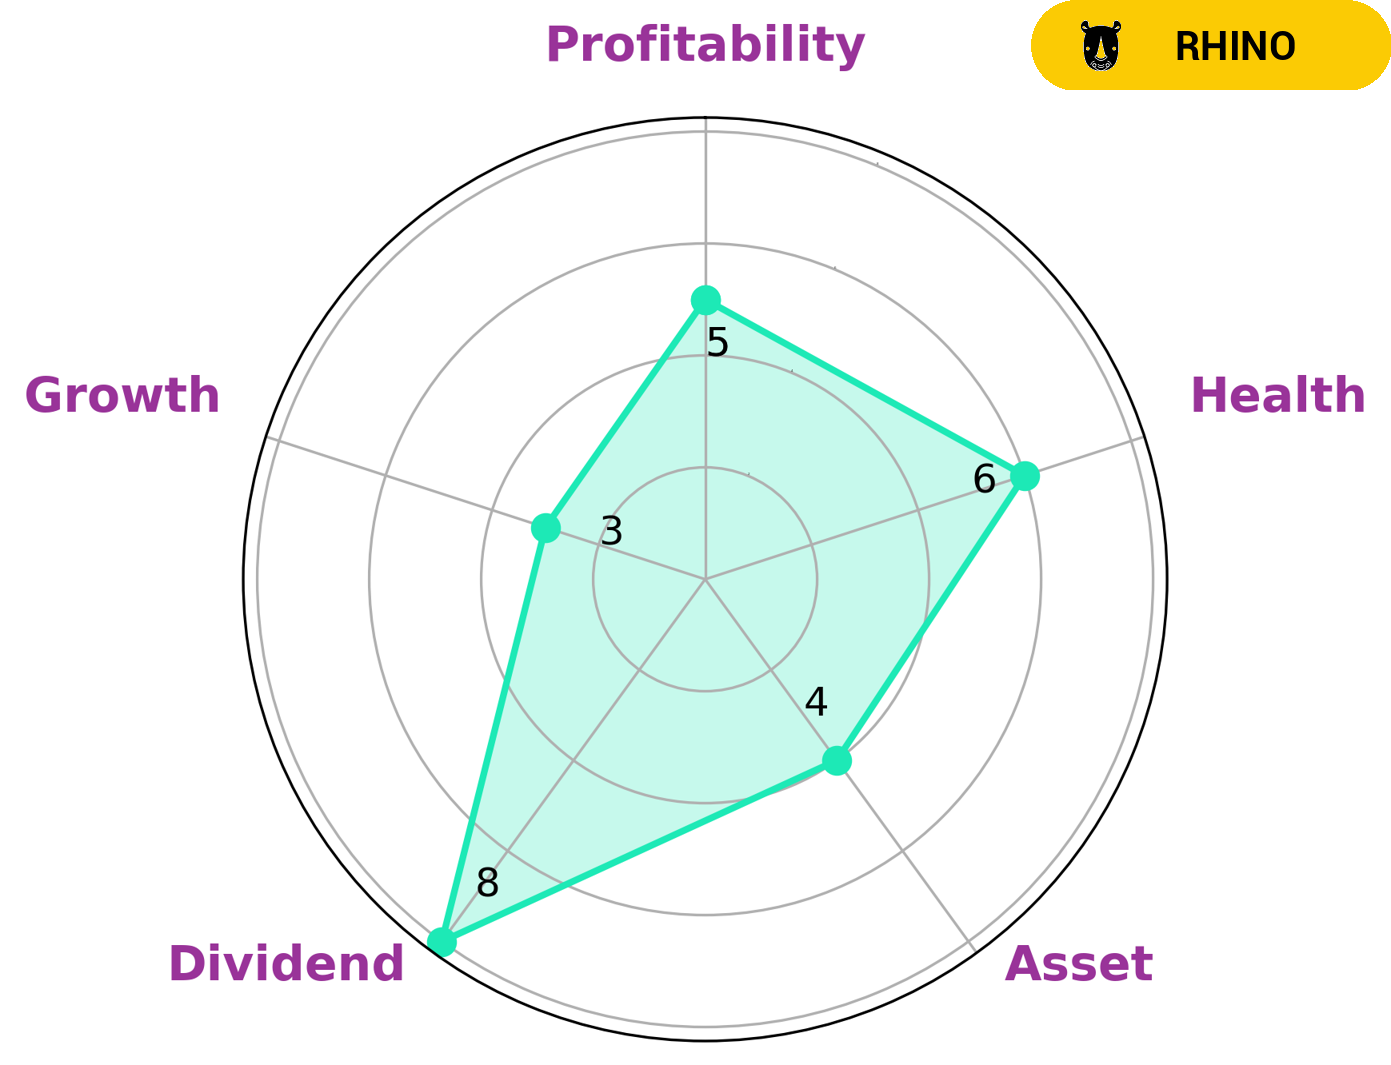
GoodWhale analysts have analyzed the fundamentals of GENERAL MOTORS and have classified it as a ‘cheetah’ company, which implies that it has achieved high revenue or earnings growth but is considered less stable due to lower profitability. Given this analysis, investors who are seeking higher returns but are willing to take on more risk may be interested in investing in GENERAL MOTORS. The Star Chart analysis reveals that GENERAL MOTORS is strong in medium in asset, growth, profitability and weak in dividend. Additionally, GoodWhale’s health score for GENERAL MOTORS is 6/10 with regard to its cashflows and debt, suggesting that it is likely to pay off debt and fund future operations. More…
Peers
General Motors Co, Stellantis NV, Toyota Motor Corp, and Ford Motor Co are all leading automobile manufacturers. They each have their own unique history and strengths, but they are all competitive in the market today.
– Stellantis NV ($NYSE:STLA)
Stellantis NV is a holding company that was created in 2021 through the merger of Fiat Chrysler Automobiles and Groupe PSA. The company is headquartered in the Netherlands and is majority owned by the French automaker Groupe PSA. Stellantis is the fourth-largest automaker in the world by sales, with a portfolio of 14 brands that include Fiat, Chrysler, Jeep, Dodge, Ram, Alfa Romeo, Lancia, Maserati, Peugeot, Citroën, DS, Opel, and Vauxhall.
– Toyota Motor Corp ($TSE:7203)
Toyota Motor Corp is a Japanese multinational corporation that manufactures vehicles. It has a market cap of 27.43T as of 2022 and a Return on Equity of 11.32%. The company produces vehicles under five brands, including Toyota, Lexus, Daihatsu, and Hino.
– Ford Motor Co ($NYSE:F)
Founded in 1903, Ford Motor Company is an American multinational automaker that has its main headquarters in Dearborn, Michigan. The company sells automobiles and commercial vehicles under the Ford brand and most luxury cars under the Lincoln brand. Ford also owns Brazilian SUV manufacturer Troller, an 8% stake in Aston Martin of the United Kingdom, and a 49% stake in Jiangling Motors of China. It also has joint-ventures in China, Taiwan, Thailand, Turkey, and Russia. The company is listed on the New York Stock Exchange and is controlled by the Ford family; they have minority ownership but the majority of the voting power.
As of 2022, Ford Motor Company’s market capitalization is $47.32 billion, and it has a return on equity of 23.7%. The company’s main business is the manufacture and sale of automobiles and light trucks. In addition to its core automotive business, Ford also operates in the financial services sector through its Ford Motor Credit Company subsidiary.
Summary
General Motors reported strong second quarter earnings for fiscal year 2023, with total revenue increasing by 25.1% and net income rising by 52.1%. Investors reacted negatively to the news, as the stock price moved down on the day of release. Despite the positive financial results, investors remain concerned about the company’s long-term prospects. Investors should consider the company’s competitive positioning, capital structure, and strategic objectives when evaluating potential investments.
In addition, investors should take note of the macroeconomic environment and potential risks, such as changes in regulatory policy or shifts in the automotive industry.
Related Posts


Recent Posts


