ABERCROMBIE & FITCH Reports 16.2% Increase in Revenue for Second Quarter of FY2024
September 7, 2023

☀️Earnings Overview
ABERCROMBIE ($NYSE:ANF): A&F reported a total revenue of USD 935.3 million for their second quarter earnings results for the fiscal year 2024, up 16.2% from the same period in 2023. Net income was reported at USD 56.9 million compared to a net loss of -16.8 million the previous year.
Analysis
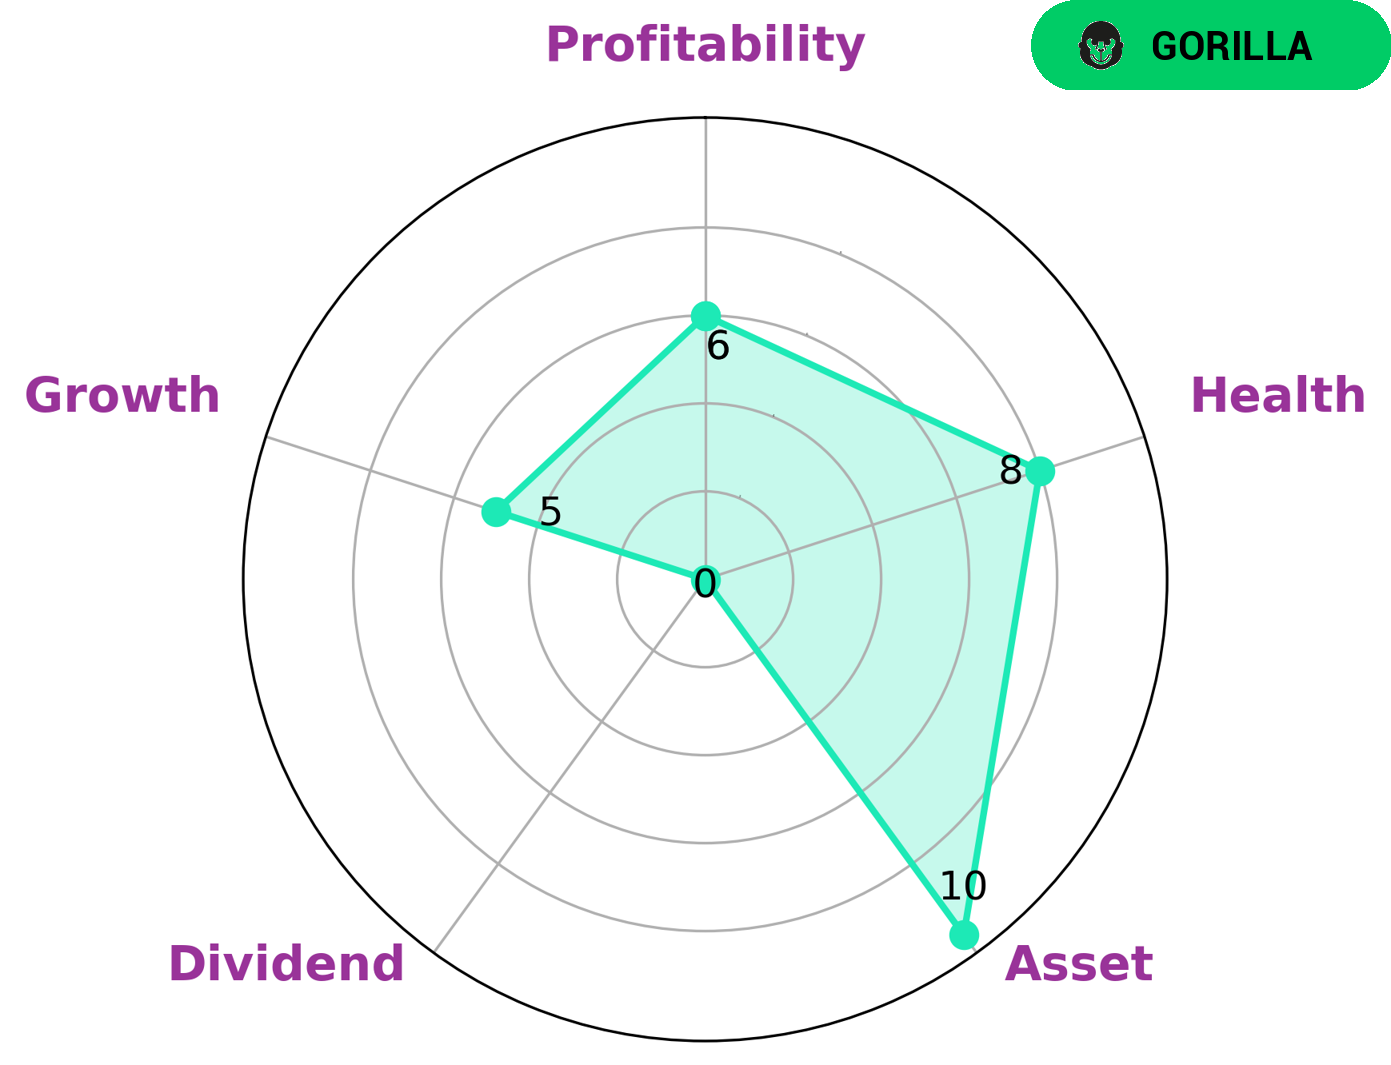
GoodWhale’s insights can provide an effective analysis of the fundamentals of ABERCROMBIE & FITCH. According to the Star Chart, ABERCROMBIE & FITCH is rated as strong in assets, medium in profitability and weak in dividend and growth. This company has a high health score of 8/10 with regard to its cashflows and debt, which means that it is capable to sustain future operations in times of crisis. Additionally, ABERCROMBIE & FITCH is classified as a ‘rhino’, a type of company which has achieved moderate revenue or earnings growth. This may appeal to value investors, who prioritize equity and asset quality over growth and dividend yield, and may be comfortable investing in a company which is not directly involved in high-growth industries or opportunities. As ABERCROMBIE & FITCH offers strong asset quality and sufficient cash flows to meet any short-term needs, it can be considered a safe option for conservative investors. Furthermore, its medium profitability rating may also be attractive to some investors who are looking for moderately-sized returns. More…
About the Company
Income Snapshot
Below shows the total revenue, net income and net margin for ANF. More…
| Total Revenues | Net Income | Net Margin |
| 3.85k | 109.58 | 3.0% |
Cash Flow Snapshot
Below shows the cash from operations, investing and financing for ANF. More…
| Operations | Investing | Financing |
| 473.72 | -178.84 | -43.25 |
Balance Sheet Snapshot
Below shows the total assets, liabilities and book value per share for ANF. More…
| Total Assets | Total Liabilities | Book Value Per Share |
| 2.8k | 2.02k | 15.35 |
Key Ratios Snapshot
Some of the financial key ratios for ANF are shown below. More…
| 3Y Rev Growth | 3Y Operating Profit Growth | Operating Margin |
| 6.0% | 193.0% | 6.0% |
| FCF Margin | ROE | ROA |
| 7.2% | 19.7% | 5.2% |
Peers
Competition between Abercrombie & Fitch Co and its competitors, Gap Inc, Children’s Place Inc, and Ross Stores Inc, is fierce. All four companies specialize in retail apparel and strive to offer their customers the best products and services. As a result, each company constantly works to outpace the others in terms of product offerings, store locations, and customer service.
– Gap Inc ($NYSE:GPS)
Gap Inc is a leading apparel retail company based in San Francisco, California. The company offers apparel, accessories, and personal care products for men, women, and children through its brands, which include Gap, Old Navy, Banana Republic, Athleta, and Intermix. As of 2022, Gap Inc. has a market capitalization of 4.4 billion dollars and a return on equity of -0.62%. This is lower than the industry average for apparel retail companies, indicating that the company has not been able to generate a satisfactory return on its equity investments. However, the company’s market capitalization of 4.4 billion dollars suggests that investors are still confident in the company’s future prospects.
– Children’s Place Inc ($NASDAQ:PLCE)
Children’s Place Inc is a popular children’s apparel retailer with a market cap of 461.48M as of 2022. The company offers a variety of clothing, accessories, and footwear for kids ranging from newborn to age 14. They have an impressive Return on Equity of 41.18%, which is a measure of the company’s ability to generate income from shareholders’ investments. This is a strong indicator of the company’s financial health and its ability to make efficient use of capital. The Children’s Place Inc is well-positioned to continue to provide great products and services to its customers in the years to come.
– Ross Stores Inc ($NASDAQ:ROST)
Ross Stores Inc is a leading off-price retailer in the United States. It operates 1,400 stores in 39 states, the District of Columbia, and Guam. The company offers apparel, accessories, footwear, and home fashions at discounts of 20% to 60% below department and specialty store regular prices. As of 2022, Ross Stores Inc has a market capitalization of 39.77B and a Return on Equity (ROE) of 29.12%. This reflects the company’s strong financial performance and ability to generate significant returns for its shareholders. Ross Stores has consistently recorded positive earnings growth for over 10 years and is well positioned for future growth.
Summary
ABERCROMBIE & FITCH reported strong year-over-year financial results for the second quarter of FY2024, with total revenue increasing by 16.2% to USD 935.3 million, and net income increasing to USD 56.9 million compared to the -16.8 million reported last year. This could be seen as a positive sign for investors, suggesting that ABERCROMBIE & FITCH are managing their financial operations effectively and can capitalize on the growth opportunities present in the market. Investors should take note of this trend, as it may indicate that ABERCROMBIE & FITCH are become an increasingly attractive investment option over time.
Related Posts


Recent Posts


