V2x Inc Intrinsic Value – V2X INC Reports 4.5% Year-Over-Year Growth in Revenue for FY2023 Q3, Totaling USD 1001.5 Million
November 29, 2023

☀️Earnings Overview
On November 6 2023, V2X INC ($NYSE:VVX) reported their earnings results for FY2023 Q3, which revealed a total revenue of USD 1001.5 million, a year-on-year increase of 4.5%. Additionally, the company saw a significant improvement in their net income, amounting to USD -6.4 million – compared to the same quarter last year’s -17.0 million.
Analysis – V2x Inc Intrinsic Value
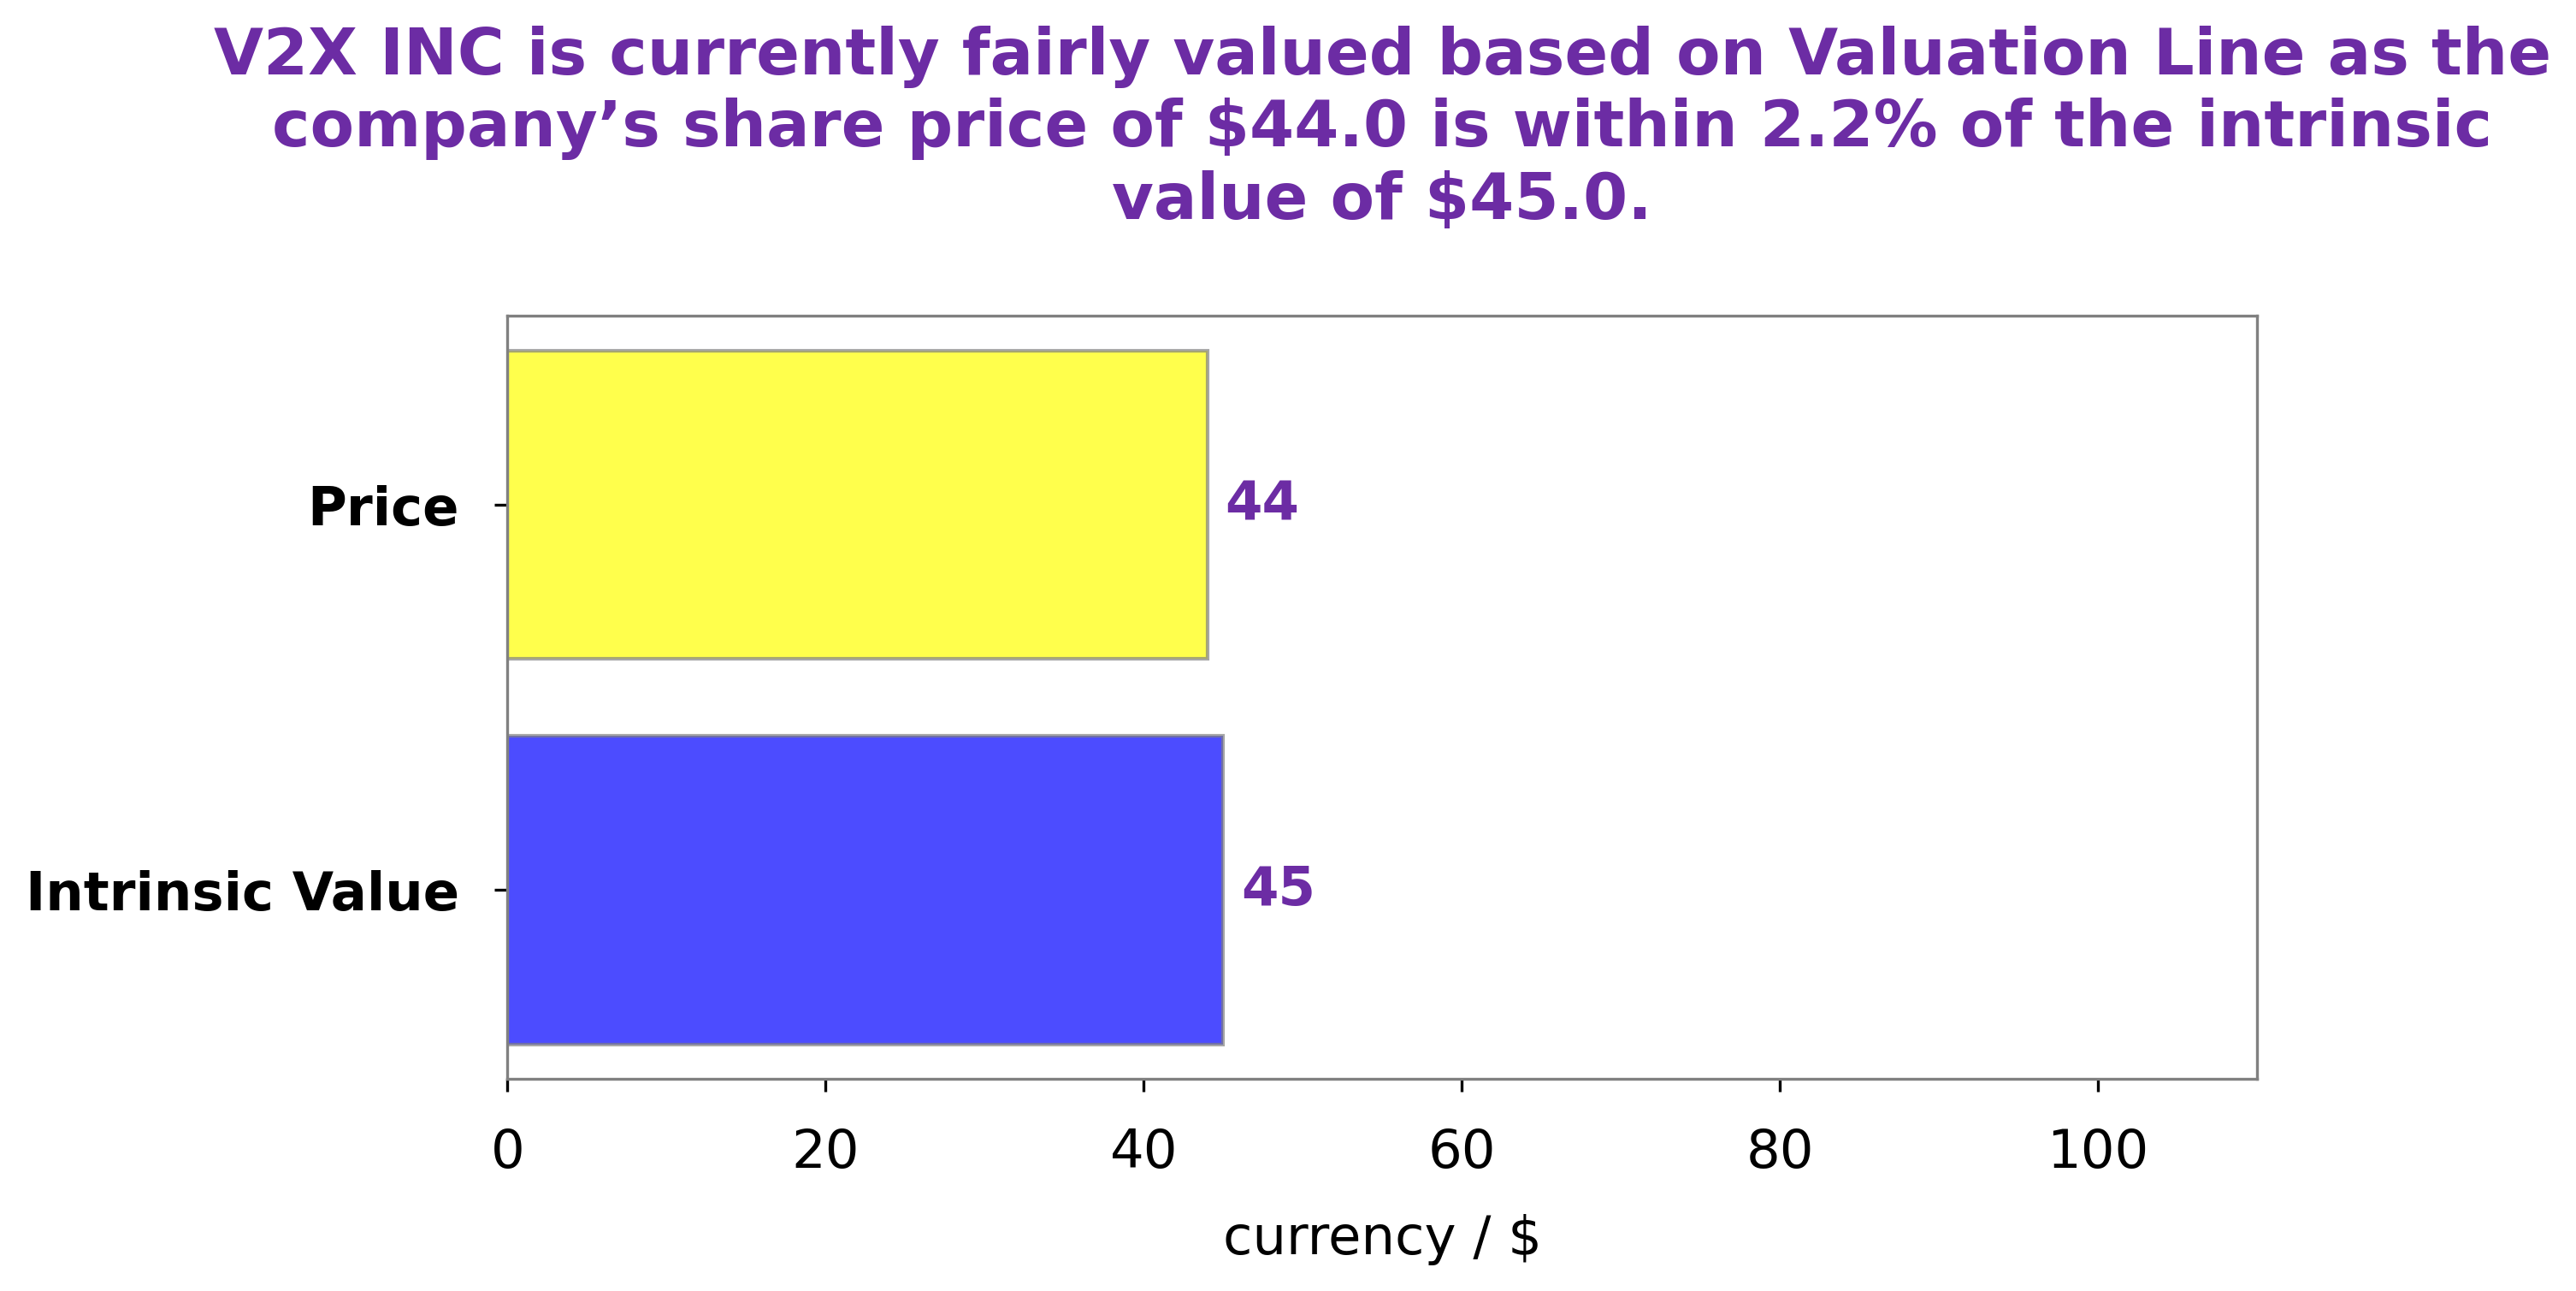
GoodWhale has conducted an in-depth analysis of V2X INC‘s wellbeing. Using our proprietary Valuation Line, we determined that the fair value of the stock is approximately $45.1. However, the current market price for V2X INC is only $40.7, indicating that the stock is undervalued by 9.8%. This presents an attractive opportunity for investors looking to make a profit on their investments. In order to gain a more comprehensive understanding of the company’s financials, we recommend conducting further research into V2X INC’s financial statements. We believe that this additional knowledge will provide valuable insights on the company’s performance, helping investors make a more informed decision on whether or not to invest in the stock. More…
About the Company
Income Snapshot
Below shows the total revenue, net income and net margin for V2x Inc. More…
| Total Revenues | Net Income | Net Margin |
| 3.9k | -32.7 | -0.4% |
Cash Flow Snapshot
Below shows the cash from operations, investing and financing for V2x Inc. More…
| Operations | Investing | Financing |
| 137.11 | -25.97 | -183.72 |
Balance Sheet Snapshot
Below shows the total assets, liabilities and book value per share for V2x Inc. More…
| Total Assets | Total Liabilities | Book Value Per Share |
| 3.13k | 2.14k | 31.72 |
Key Ratios Snapshot
Some of the financial key ratios for V2x Inc are shown below. More…
| 3Y Rev Growth | 3Y Operating Profit Growth | Operating Margin |
| 40.5% | 35.1% | 2.4% |
| FCF Margin | ROE | ROA |
| 3.0% | 5.9% | 1.9% |
Peers
V2X Inc is in a highly competitive market, competing against other industry leaders such as Hanwha Systems Co Ltd, Sika Interplant Systems Ltd, and Elbit Systems Ltd. All of these companies strive for success and to provide innovative and reliable products and services to their customers. With the ever-changing technology landscape, V2X Inc continues to stay ahead of the competition to remain a leader in the industry.
– Hanwha Systems Co Ltd ($KOSE:272210)
Hanwha Systems Co. Ltd is a South Korean technology company that specializes in providing defense, aerospace, and industrial solutions to its customers. With a market capitalization of 2.48T as of 2023, Hanwha Systems Co. Ltd is one of the largest technology companies in South Korea. Furthermore, the company has been able to achieve a Return on Equity of 8.84%, indicating that the company is more efficient in generating returns from its investments than its peers. This makes Hanwha Systems a great long-term investment option for investors.
– Sika Interplant Systems Ltd ($BSE:523606)
Sika Interplant Systems Ltd is a global leader in the provision of advanced manufacturing technology and automation solutions. The company specializes in various areas such as factory automation, machine design, and robotics. With a market cap of 4.68B as of 2023, it is one of the largest industrial automation companies in the world. Furthermore, the company has an impressive Return on Equity (ROE) of 10.21%. This ratio indicates the company’s ability to generate profits compared to its total equity. This shows that Sika Interplant Systems Ltd is well-positioned to capitalize on its strong balance sheet and generate profits for its shareholders.
– Elbit Systems Ltd ($NASDAQ:ESLT)
Elbit Systems Ltd. is a defense technology company based in Israel that specializes in the development, production, and integration of defense and homeland security systems. It is a major player in the international defense industry due to its advanced technology and innovative products. With a market cap of 8.9 billion as of 2023, it is one of the largest defense companies in the world. Additionally, Elbit Systems has a return on equity of 8.16%, which is above the industry average and indicates that the company is efficiently allocating capital and generating returns for investors.
Summary
Investors should analyze V2X INC carefully before investing. The company reported total revenue of USD 1001.5 million for FY2023 Q3, a 4.5% year-over-year increase, and net income of USD -6.4 million, a significant improvement compared to last year’s -17.0 million. Unfortunately, the stock price dropped the same day as the earnings release. Investors should research the company’s recent financial performance, competitive positioning, and management strategy to evaluate whether the stock’s current valuation represents a good investment opportunity.


