PPG INDUSTRIES Earnings Surpass Expectations Despite Lower Revenues
April 21, 2023

Trending News ☀️
PPG ($NYSE:PPG) Industries reported a non-GAAP earnings per share (EPS) of $1.82, beating analyst estimates by $0.27 while their reported revenue of $4.38B came up short of expectations by $10M. The Pennsylvania-based company is a leading supplier of paints and coatings to the industrial, aerospace, automotive, commercial and residential markets. The company’s products are used not only to protect and enhance the performance of vehicles, buildings and homes, but also for a wide range of decorative and aesthetic purposes. Despite the lower than expected revenues, PPG Industries was able to beat earnings expectations due to cost-saving measures and strategic pricing initiatives.
The company’s strong balance sheet and cash flows allowed them to weather the storm and come out with a successful quarter. Overall, PPG Industries’ earnings were a positive sign for long-term investors as the company continues to focus on improving its operations.
Stock Price
PPG Industries, a global manufacturer and supplier of paints, coatings and specialty materials, reported earnings on Thursday that exceeded expectations despite lower revenues. On Thursday, PPG Industries stock opened at $139.5 and closed at $141.4, up by 0.6% from the previous closing price of $140.6. This strong performance was driven by cost-saving measures and an increase in selling prices. Overall, the company’s earnings performance was better than expected and reflects a successful cost-cutting strategy. Live Quote…
About the Company
Income Snapshot
Below shows the total revenue, net income and net margin for Ppg Industries. More…
| Total Revenues | Net Income | Net Margin |
| 17.65k | 1.03k | 7.0% |
Cash Flow Snapshot
Below shows the cash from operations, investing and financing for Ppg Industries. More…
| Operations | Investing | Financing |
| 963 | -461 | -409 |
Balance Sheet Snapshot
Below shows the total assets, liabilities and book value per share for Ppg Industries. More…
| Total Assets | Total Liabilities | Book Value Per Share |
| 20.74k | 14.04k | 25.67 |
Key Ratios Snapshot
Some of the financial key ratios for Ppg Industries are shown below. More…
| 3Y Rev Growth | 3Y Operating Profit Growth | Operating Margin |
| 5.2% | -4.2% | 8.8% |
| FCF Margin | ROE | ROA |
| 2.5% | 15.3% | 4.7% |
Analysis
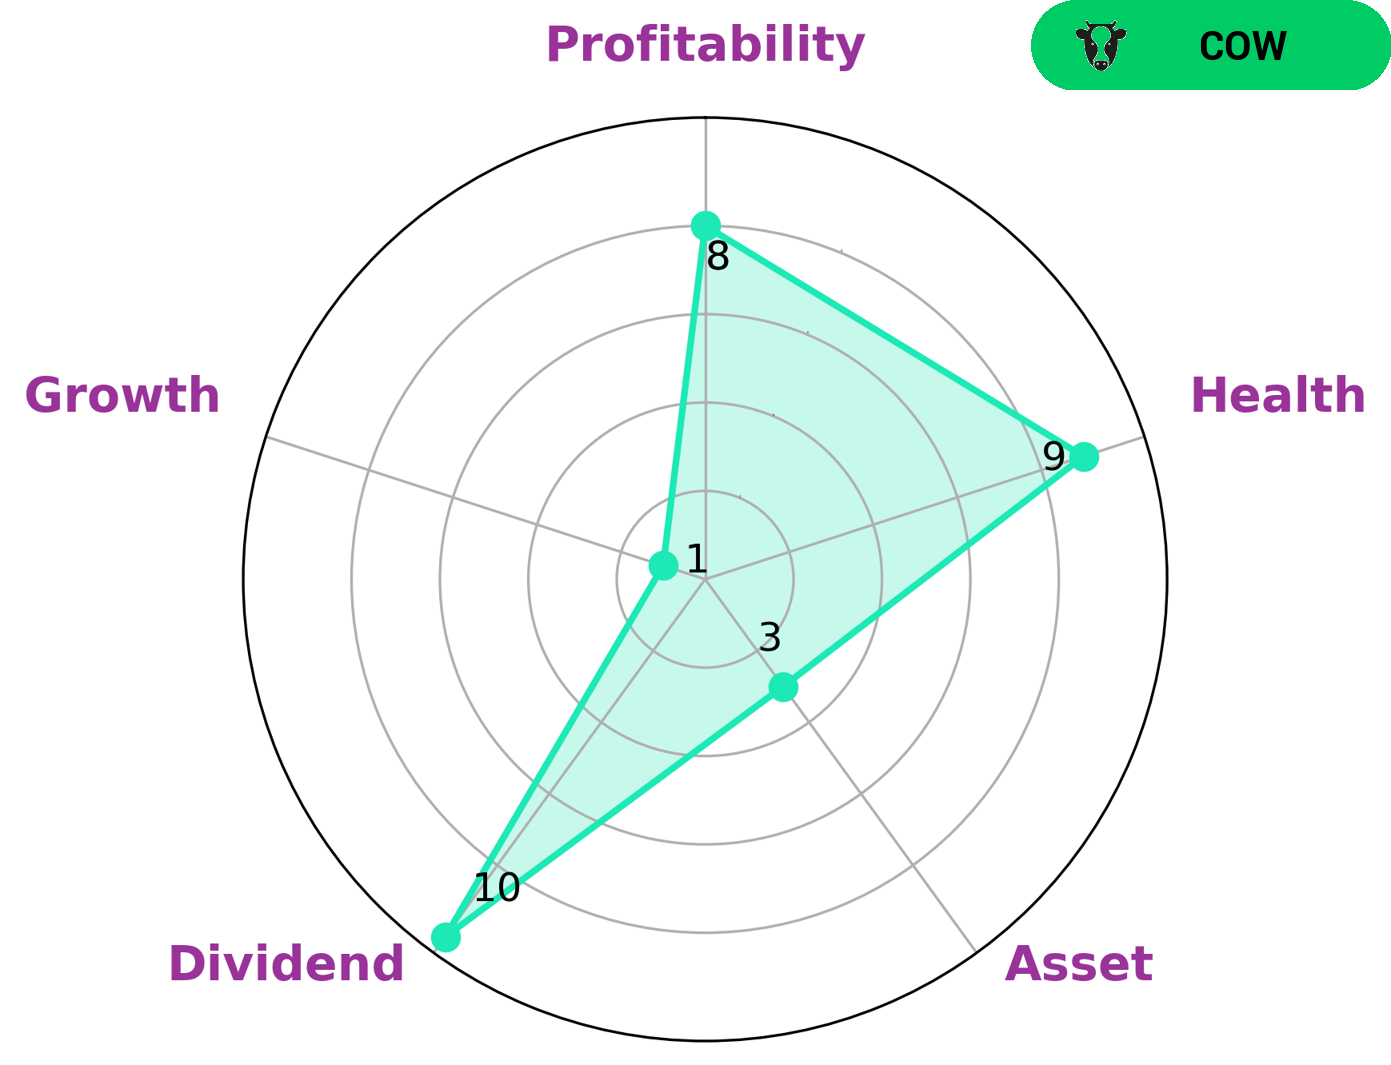
At GoodWhale, we conducted an analysis of PPG INDUSTRIES‘s financials. According to our Star Chart rating system, PPG INDUSTRIES is strong in dividend, profitability, and weak in asset growth. We assigned it a high health score of 9/10 with regard to its cashflows and debt, which suggests that it is capable to pay off debt and fund future operations. Additionally, we have classified PPG INDUSTRIES as a ‘cow’, a type of company that has a track record of paying out consistent and sustainable dividends. Given its strong dividend, profitability and debt-paying capabilities, investors who are looking for a steady and reliable income flow may be interested in PPG INDUSTRIES. Furthermore, the company’s health score is an indication that it is capable of continuing to pay out dividends in the future. As such, those who prioritize dividend payments may be interested in the company. More…
Peers
PPG Industries Inc and its competitors Trinseo PLC, LyondellBasell Industries NV, Covestro AG are all engaged in a fierce competition to be the leading chemical company globally. All four companies have their own unique strengths and weaknesses, and each is trying to gain an edge over the others. The competition between these companies is expected to heat up even further in the coming years.
– Trinseo PLC ($NYSE:TSE)
Trinseo PLC is a global materials company with a market cap of 630.21M as of 2022. The company has a strong focus on sustainability and is committed to being a force for good in the world. Trinseo’s products are used in a wide variety of applications, including automotive, consumer electronics, and construction. The company has a strong focus on research and development, and is constantly innovating to bring new and better products to market. Trinseo’s return on equity is 20.36%.
– LyondellBasell Industries NV ($NYSE:LYB)
LyondellBasell Industries NV is a Netherlands-based company engaged in the production of chemicals and polymers. The Company’s product portfolio includes olefins and polyolefins, and a range of derived products. LyondellBasell Industries NV, through its subsidiaries, operates in Europe, the United States, Asia Pacific, the Middle East and Africa.
– Covestro AG ($OTCPK:COVTY)
Covestro AG is a world-leading producer of high-performance polymers. The company’s innovative and sustainable products are used in a wide range of industries, from construction and electronics to sports and leisure. Covestro is headquartered in Leverkusen, Germany, and has around 16,800 employees worldwide. The company’s market cap is 6.67B as of 2022, and it has a return on equity of 14.83%. Covestro is a publicly traded company on the Frankfurt Stock Exchange.
Summary
PPG Industries reported fourth quarter results that beat earnings per share (EPS) expectations but missed revenue estimates. Investors may want to consider these results in the context of PPG Industries’financial performance over the past year to better understand the implications of this earnings report.


