Applied Materials Beats Earnings and Revenue Estimates with Non-GAAP EPS of $2.00
May 19, 2023

Trending News 🌥️
The company beat earnings and revenue estimates with Non-GAAP EPS of $2.00, surpassing expectations of $1.83, and revenue of $6.63B, above the estimated amount of $6.37B.
In addition, Applied Materials ($NASDAQ:AMAT) completed a number of strategic acquisitions to strengthen their product portfolio and increase their competitive advantage. Going forward, Applied Materials is well-positioned for growth and expansion, as customer demand for their products and services remains high. The company is also continuing to invest in research and development to ensure that they remain at the forefront of the industry. For investors, Applied Materials is an attractive stock with potential for long-term growth.
Earnings
APPLIED MATERIALS has recently released their earning report for FY2023 Q1 ending on January 31 2023. The company reported total revenue of 6.74B USD and net income of 1.72B USD. This represents a 7.5% increase in total revenue compared to the same period in the previous year, while net income decreased by 3.9%.
Over the past three years, APPLIED MATERIALS has seen total revenue increase from 5.16B USD to 6.74B USD. Their non-GAAP earnings per share (EPS) was $2.00, surpassing estimates and providing a positive outlook for the company.
About the Company
Income Snapshot
Below shows the total revenue, net income and net margin for Applied Materials. More…
| Total Revenues | Net Income | Net Margin |
| 26.25k | 6.45k | 24.6% |
Cash Flow Snapshot
Below shows the cash from operations, investing and financing for Applied Materials. More…
| Operations | Investing | Financing |
| 5.01k | -1.52k | -5.21k |
Balance Sheet Snapshot
Below shows the total assets, liabilities and book value per share for Applied Materials. More…
| Total Assets | Total Liabilities | Book Value Per Share |
| 27.96k | 14.54k | 15.88 |
Key Ratios Snapshot
Some of the financial key ratios for Applied Materials are shown below. More…
| 3Y Rev Growth | 3Y Operating Profit Growth | Operating Margin |
| 20.5% | 30.7% | 30.0% |
| FCF Margin | ROE | ROA |
| 15.5% | 38.4% | 17.6% |
Stock Price
This was reflected in the stock price which opened at $125.8 and closed at $129.9, up by 3.4% from the previous closing price of $125.7. The higher revenue was mainly due to a strong showing across all segments. Furthermore, Applied Materials also announced that it had approved a new $2 billion authorization for share repurchases.
Overall, Applied Materials delivered impressive results and exceeded analysts’ expectations across all metrics. The stock has been steadily increasing since the company released its first-quarter results and is likely to continue to rise in the coming weeks. Live Quote…
Analysis
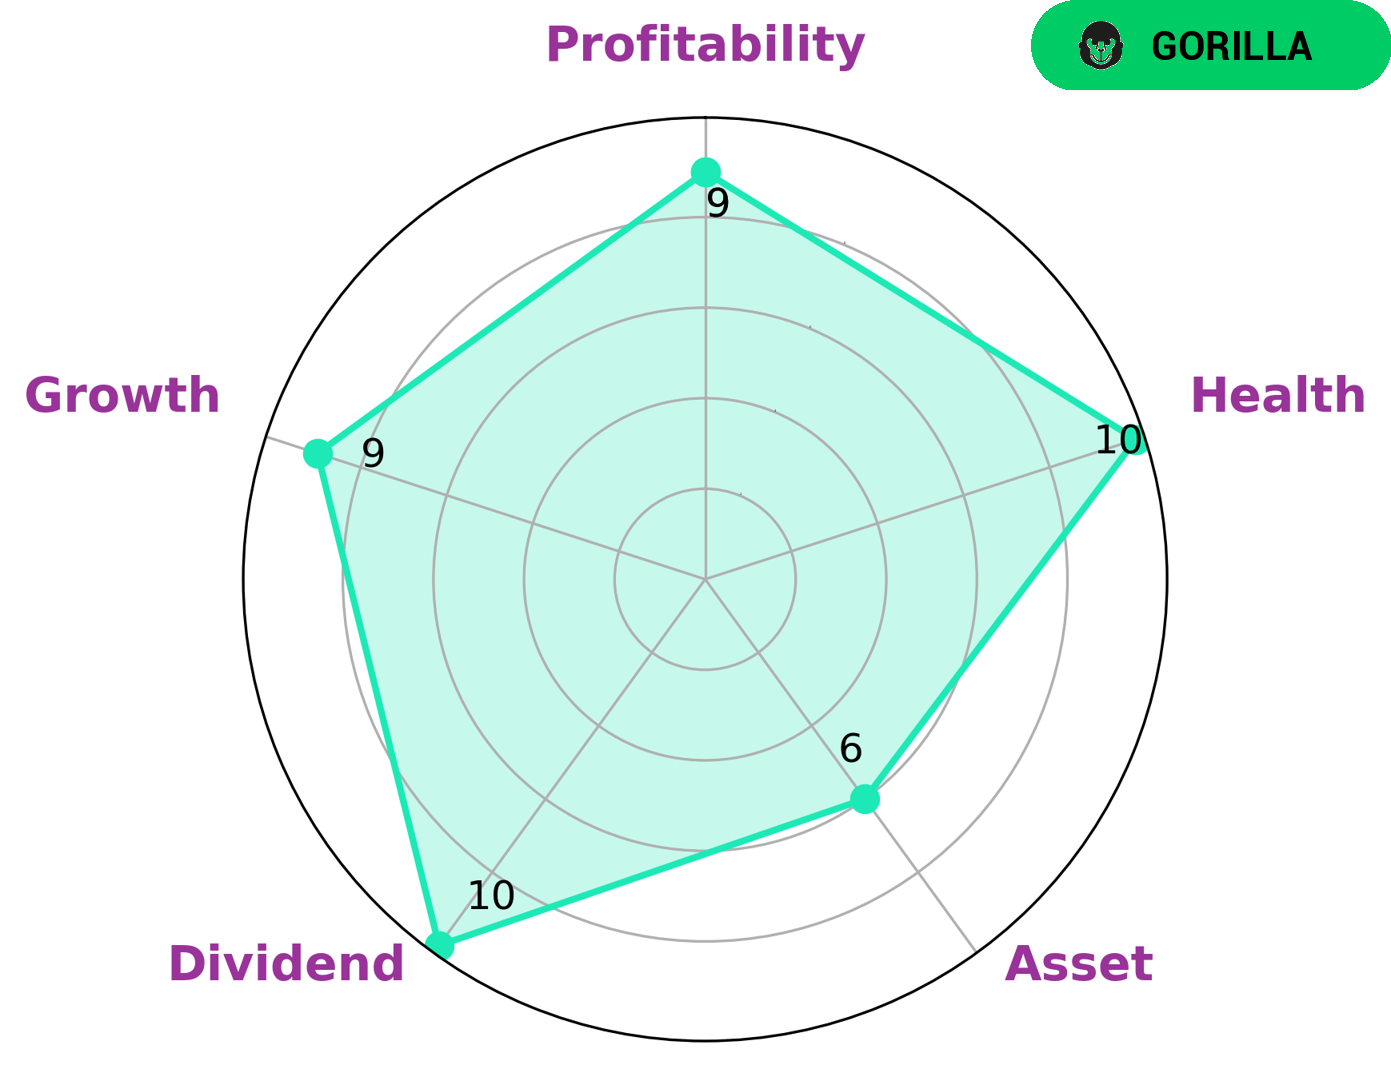
At GoodWhale, we analyzed APPLIED MATERIALS‘s financials and used our Star Chart to highlight the company’s strengths. According to our assessment, APPLIED MATERIALS is strong in dividend, growth, profitability, and medium in asset. With that said, we are pleased to find that APPLIED MATERIALS has a high health score of 10/10 considering its cashflows and debt, coming to the conclusion that the company is capable to safely ride out any crisis without the risk of bankruptcy. Furthermore, we have classified APPLIED MATERIALS as a ‘gorilla’, a type of company that has achieved stable and high revenue or earning growth due to its strong competitive advantage. Considering such, investors who are seeking long term stability and growth may be interested in APPLIED MATERIALS as it can offer such advantages. More…
Peers
Applied Materials, Inc. and its competitors, Lam Research Corporation, KLA Corporation, and ASML Holding NV, compete in the semiconductor equipment industry. This industry is capital intensive, with high barriers to entry. The four companies have similar business models, but Applied Materials has a slight edge in terms of market share.
– Lam Research Corp ($NASDAQ:LRCX)
Lam Research Corporation is a company that manufactures semiconductor processing equipment. It is headquartered in Fremont, California, and has been in business since 1980. The company has a market capitalization of $51.81 billion as of 2022 and a return on equity of 54.63%. Lam Research Corporation is a leading supplier of wafer processing equipment to the semiconductor industry. The company’s products are used in the manufacturing of integrated circuits (ICs), which are the tiny electronic components that are found in everything from computers to cell phones. Lam Research Corporation’s products are used in all stages of IC production, from the initial deposition of materials on the wafer to the final etching of the completed circuits.
– KLA Corp ($NASDAQ:KLAC)
KLA Corp is a leader in process equipment and services for the semiconductor and nanoelectronics industries. The company has a market cap of $43.23 billion and a return on equity of 126.76%. KLA Corp provides products and services that enable the manufacturing of advanced semiconductor chips. The company’s products are used by customers in the fab process of making chips, including etching, metrology, and inspection. KLA Corp’s services enable customers to optimize their productivity and yield. The company has a strong history of innovation and is a trusted partner to the world’s leading chipmakers.
– ASML Holding NV ($NASDAQ:ASML)
ASML Holding NV is a technology company that manufactures semiconductor processing equipment, which is used in the production of integrated circuits (ICs). ASML’s products are used by customers in the computer, communications, and consumer electronics industries. The company has a market cap of 187.16B as of 2022 and a return on equity of 39.55%. ASML is headquartered in the Netherlands and has offices in Europe, the United States, Asia, and Japan.
Summary
The stock price moved up on the news, indicating that investors are pleased with the results. The company has been able to expand their market share and increase profitability by making strategic investments in new technologies. They have also benefited from strong demand from the semiconductor industry in recent quarters. Going forward, investors should continue to monitor Applied Materials as they look to capitalize on their current momentum and build on their success.


