Par Pacific Intrinsic Stock Value – Par Pacific Reports Record Q3 Results, Surpassing Expectations by $210M in Revenue and $0.30 in EPS
May 5, 2023

Trending News 🌥️
Par Pacific ($NYSE:PARR), a leading energy and logistics company, has just reported record third-quarter results that have exceeded expectation. The company reported Non-GAAP earnings of $2.25 per share, $0.30 above the predicted earnings, and revenue of $1.68 billion, surpassing forecasts by $210 million. Par Pacific is a publicly traded holding company that owns and operates energy and logistics businesses in the United States and Canada. It produces, stores, distributes, and markets crude oil, refined products, and other energy-related products.
In addition, Par Pacific’s logistics business offers transportation and storage services for crude oil and other products. In addition, its refining operations have also contributed to the company’s overall success, as they have achieved higher than expected throughput volumes. Par Pacific’s record third-quarter results demonstrate the company’s continued commitment to growth and profitability. These impressive numbers have surpassed expectations, highlighting Par Pacific’s strong performance this quarter and its potential for future success.
Earnings
In their latest earning report of FY2022 Q4 as of December 31 2022, PAR PACIFIC earned a total revenue of 1808.88M USD and a net income of 84.72M USD. This impressive result is marked by a 39.8% increase in total revenue and a 947.2% increase in net income compared to the previous year. Over the span of the last 3 years, PAR PACIFIC’s total revenue has risen from 715.5M USD to 1808.88M USD, a tremendous achievement for the company. These results are sure to excite investors and build confidence in the potential of PAR PACIFIC for the future.
About the Company
Income Snapshot
Below shows the total revenue, net income and net margin for Par Pacific. More…
| Total Revenues | Net Income | Net Margin |
| 7.32k | 364.19 | 5.1% |
Cash Flow Snapshot
Below shows the cash from operations, investing and financing for Par Pacific. More…
| Operations | Investing | Financing |
| 452.61 | -87.31 | 13.41 |
Balance Sheet Snapshot
Below shows the total assets, liabilities and book value per share for Par Pacific. More…
| Total Assets | Total Liabilities | Book Value Per Share |
| 3.28k | 2.64k | 10.66 |
Key Ratios Snapshot
Some of the financial key ratios for Par Pacific are shown below. More…
| 3Y Rev Growth | 3Y Operating Profit Growth | Operating Margin |
| 10.7% | 42.5% | 5.9% |
| FCF Margin | ROE | ROA |
| 5.5% | 45.4% | 8.3% |
Market Price
Despite the strong results, PAR PACIFIC‘s stock opened Wednesday at $22.3 and closed at $21.8, representing a 3.3% decrease from the previous closing price of 22.5. The stock’s dip could be attributed to the company’s failure to meet some of the analysts’ expectations in terms of profit margin. Live Quote…
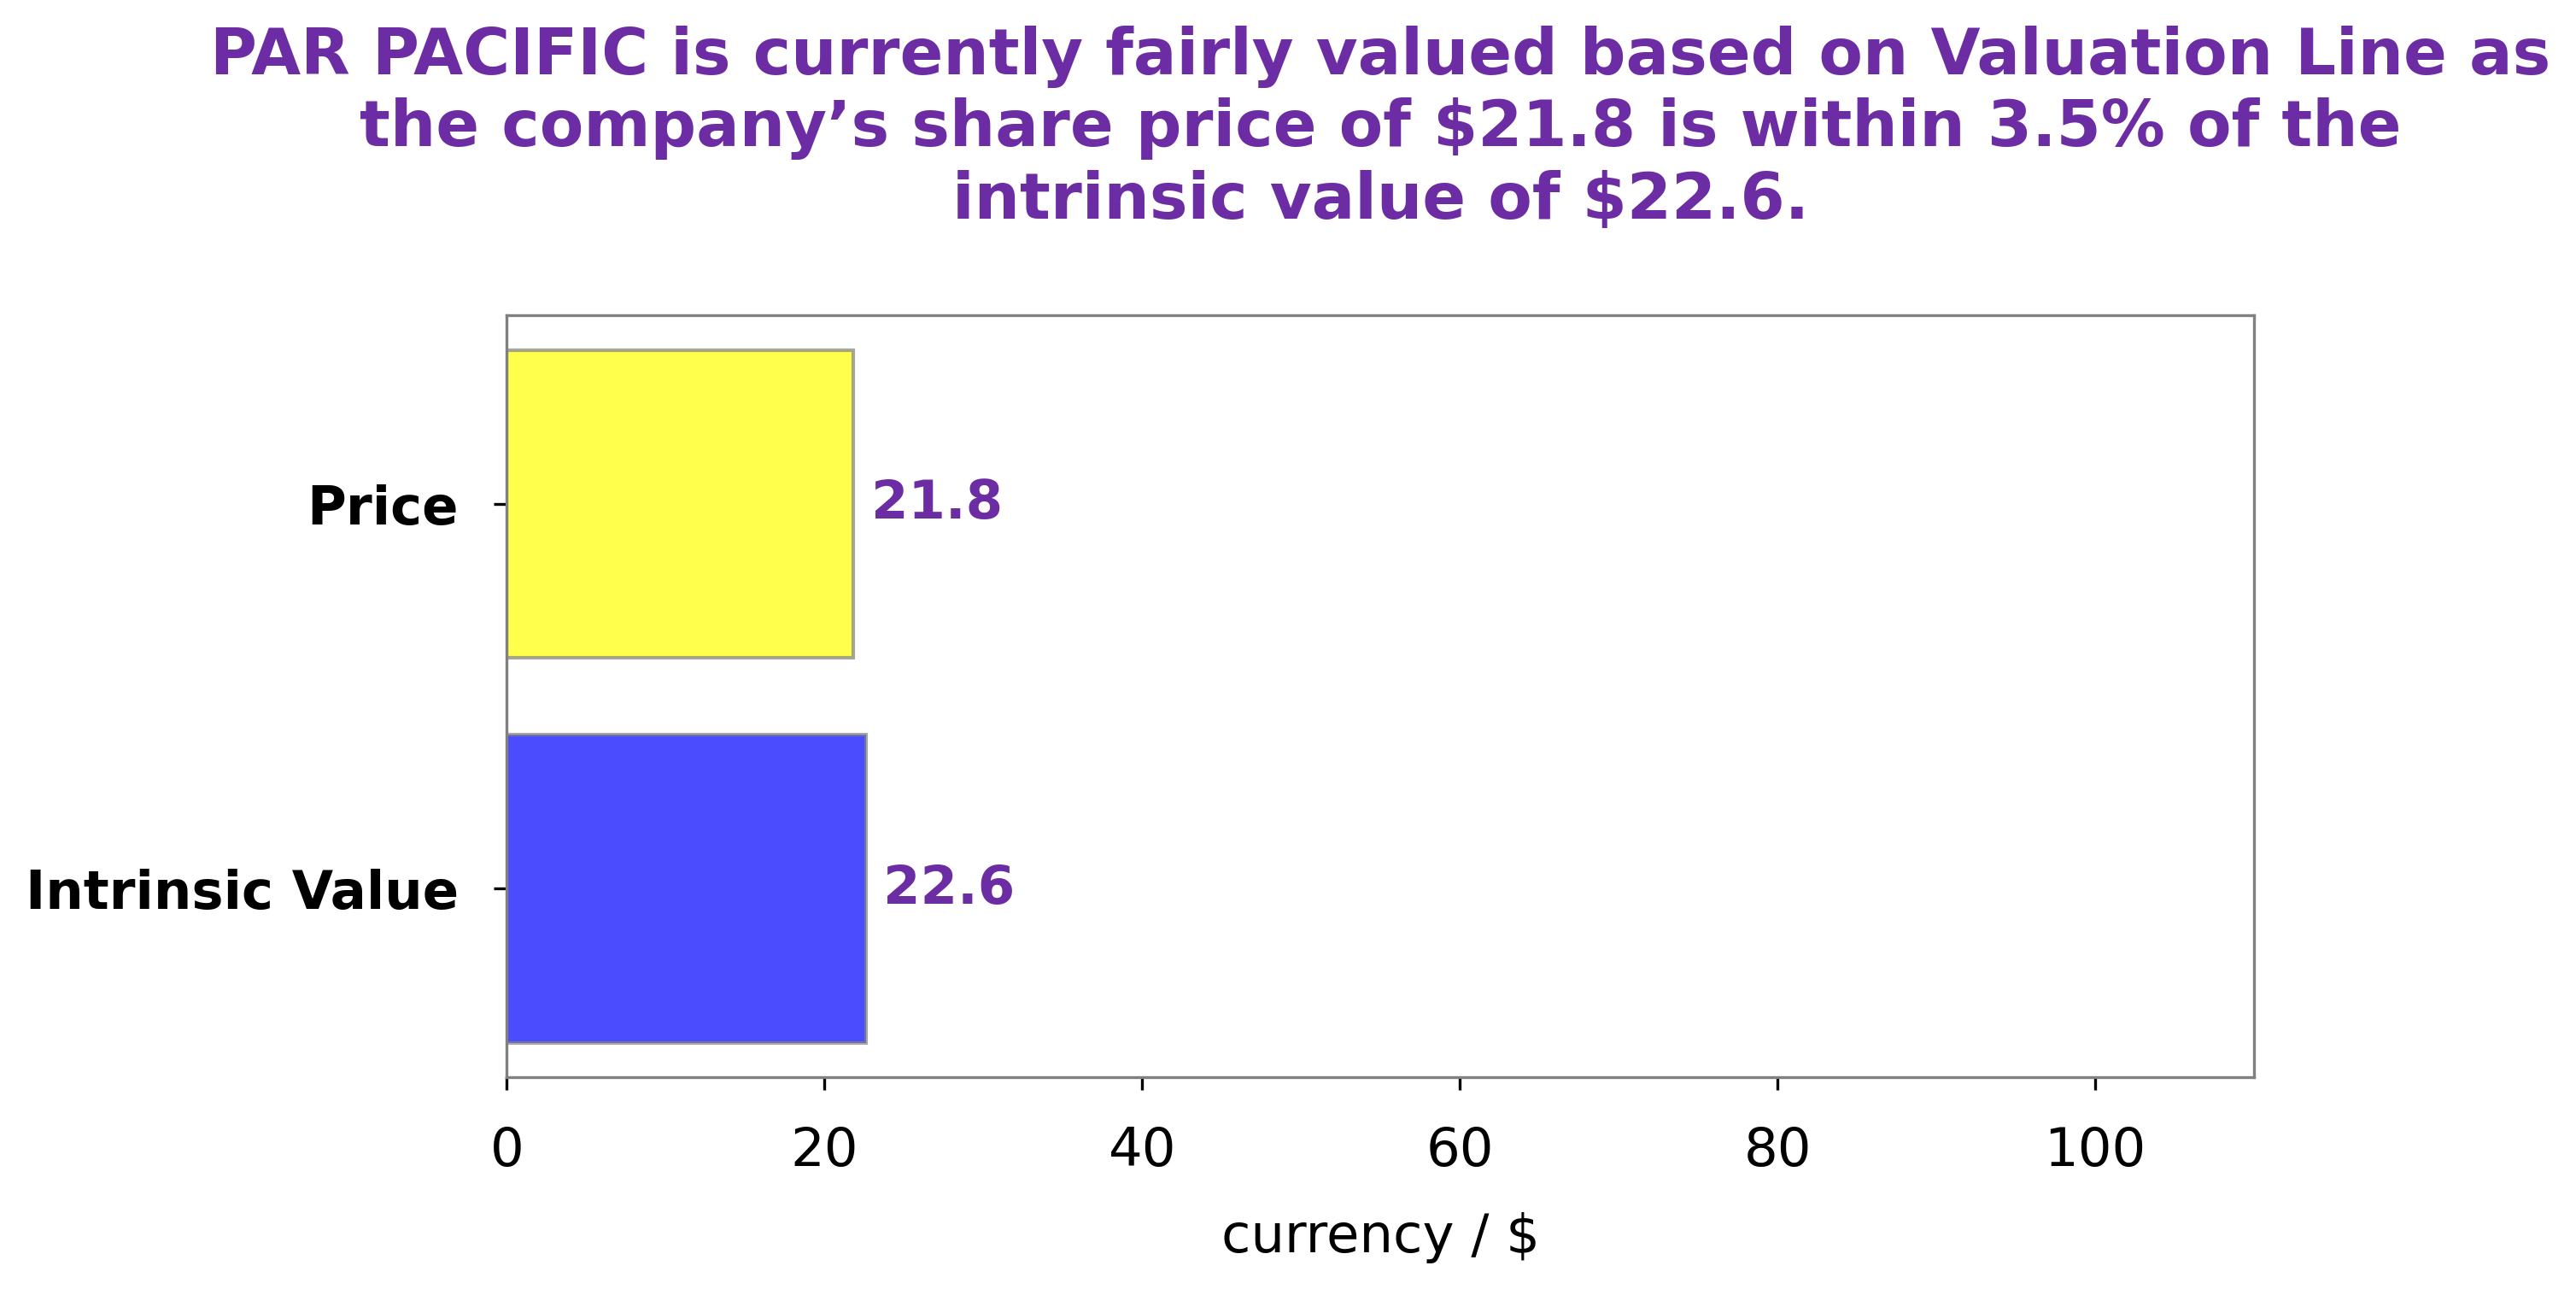
Analysis – Par Pacific Intrinsic Stock Value
GoodWhale analyzed PAR PACIFIC‘s financials and found that its intrinsic value is $22.6, calculated using our proprietary Valuation Line. This suggests that the current price of $21.8 is slightly undervalued by 3.6%. This could present an opportunity for investors looking to purchase PAR PACIFIC stock at an attractive price. We recommend that potential investors take into account the overall market conditions before making an investment decision. More…
Peers
The competition among Par Pacific Holdings Inc and its competitors is fierce. CVR Energy Inc, HF Sinclair Corp, and PBF Energy Inc are all major players in the petroleum refining industry, and each company is striving to gain market share. The company’s innovative approach to refining has allowed it to quickly gain market share and become a major competitor.
– CVR Energy Inc ($NYSE:CVI)
CVR Energy Inc. is a petroleum refining and marketing company. It owns and operates two petroleum refineries in the United States. CVR Energy’s operations are conducted through its subsidiaries, CVR refining LP and CVR Partners LP. The company was founded in 2008 and is headquartered in Sugar Land, Texas.
– HF Sinclair Corp ($NYSE:DINO)
Sinclair Broadcast Group, Inc. is one of the largest and most diversified television broadcasting companies in the country. The company owns, operates and/or provides services to more than 190 television stations in 89 markets. Sinclair is the leading local news provider in the country, as well as a producer of sports content. Sinclair’s content is delivered via multiple-platforms, including over-the-air, multi-channel video program distributors, and digital platforms. The company also owns and operates the Tennis Channel and the Ring of Honor professional wrestling promotion.
– PBF Energy Inc ($NYSE:PBF)
PBF Energy Inc is an American oil refining and marketing company. The company owns and operates oil refineries in the United States. PBF Energy Inc has a market cap of 5.73B as of 2022 and a Return on Equity of 52.76%. The company’s primary business is the refining of crude oil into petroleum products. PBF Energy Inc also owns and operates a petrochemical plant in Delaware City, Delaware.
Summary
PAR Pacific is a publicly traded company that owns and operates energy and infrastructure businesses. Despite these positive results, its stock price dropped on the same day, possibly due to the volatile nature of the energy sector. Investors should keep an eye on PAR Pacific’s performance over the coming quarters to assess the company’s long-term potential.
Related Posts


Recent Posts


