Steel Dynamics Outperforms Market Despite Dip, Closing at $102.11
June 28, 2023

☀️Trending News
Steel Dynamics ($NASDAQ:STLD) (NYSE: STLD) ended the trading day on Monday at $102.11, increasing 1.12% from the previous session despite a market dip. This positive momentum is great news for investors in Steel Dynamics, as the company has delivered strong returns in recent years. Steel Dynamics is an American steel producer based in Fort Wayne, Indiana. The company specializes in the production of long and flat-rolled steel products, and its operations are divided into three segments: steel operations, metals recycling and ferrous resources. Steel Dynamics ships its products to customers within the United States and abroad, making it a global player in the steel industry.
Steel Dynamics is well-positioned to take advantage of the increased demand for steel worldwide. Looking ahead, Steel Dynamics is set to benefit from increasing global economic growth, particularly in emerging markets. The company has also recently announced plans to expand its presence in the U.S. and abroad, which could further drive revenue growth for the company in the coming years.
Share Price
Despite a dip in the market, STEEL DYNAMICS continues to outperform expectations. On Thursday, the stock opened at $102.1 and closed at $102.4, up by 0.3% from its closing price the day prior. This is especially impressive given the sluggish environment in which stock markets are currently operating.
STEEL DYNAMICS has seen a steady increase in their stock values throughout the year, and this latest closing of $102.11 marks another success for the company. It’s clear that STEEL DYNAMICS is a leader in the industry and is continuing to stay ahead of the competition. Live Quote…
About the Company
Income Snapshot
Below shows the total revenue, net income and net margin for Steel Dynamics. More…
| Total Revenues | Net Income | Net Margin |
| 21.58k | 3.4k | 15.7% |
Cash Flow Snapshot
Below shows the cash from operations, investing and financing for Steel Dynamics. More…
| Operations | Investing | Financing |
| 4.38k | -1.81k | -2.15k |
Balance Sheet Snapshot
Below shows the total assets, liabilities and book value per share for Steel Dynamics. More…
| Total Assets | Total Liabilities | Book Value Per Share |
| 14.22k | 5.91k | 48.87 |
Key Ratios Snapshot
Some of the financial key ratios for Steel Dynamics are shown below. More…
| 3Y Rev Growth | 3Y Operating Profit Growth | Operating Margin |
| 28.3% | 66.0% | 20.9% |
| FCF Margin | ROE | ROA |
| 15.7% | 34.2% | 19.8% |
Analysis
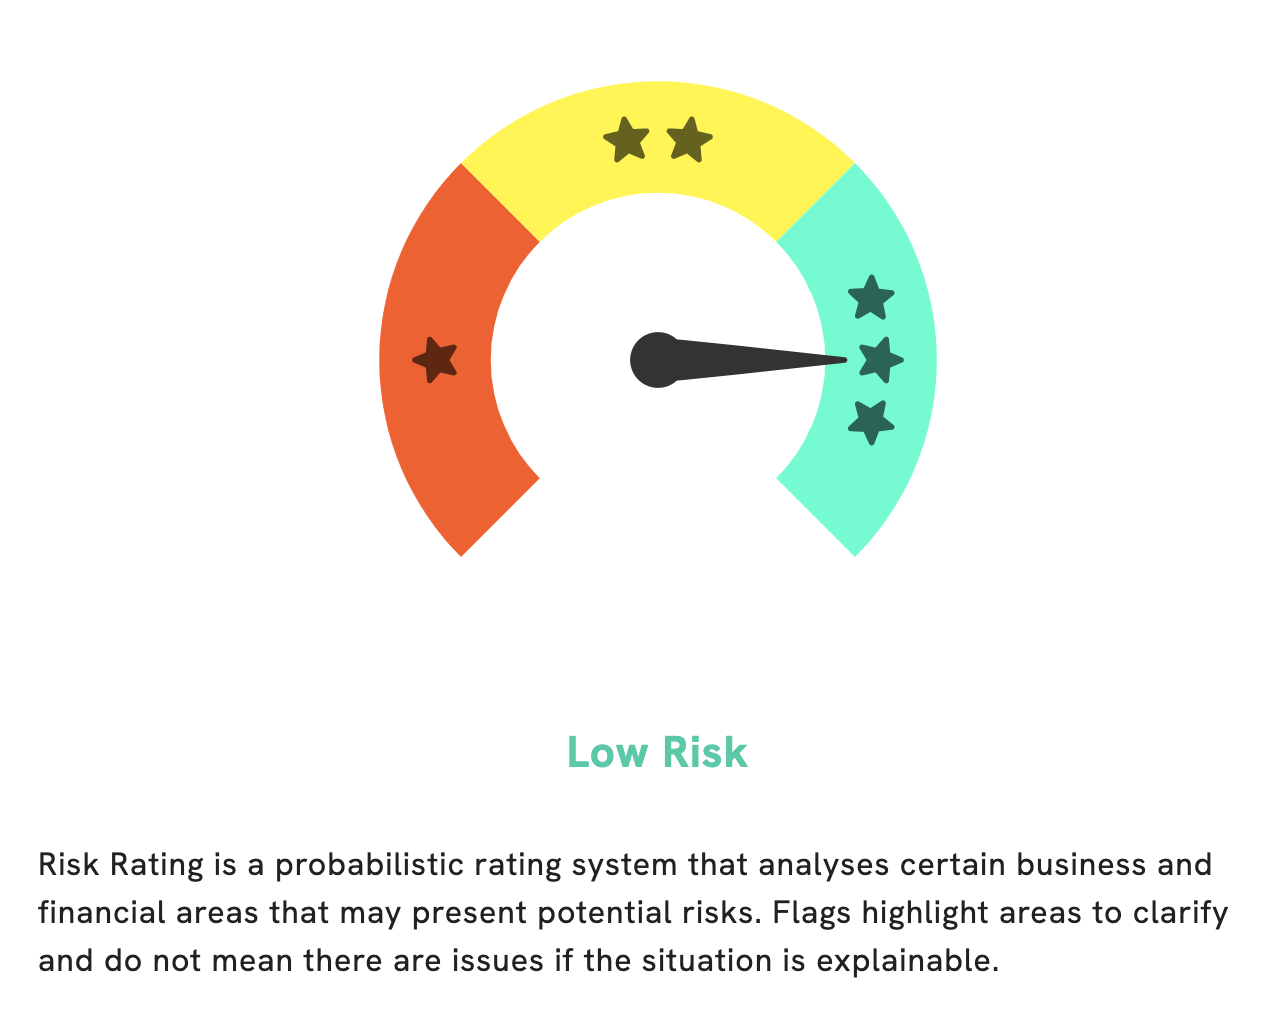
At GoodWhale, we take a holistic approach to financial analysis. We analyze STEEL DYNAMICS‘s financials in order to provide our users with an accurate overall risk rating. Our risk rating system has concluded that STEEL DYNAMICS is a low risk investment in terms of financial and business aspects. However, we have also detected 1 risk warnings in the company’s balance sheet. We invite you to register on goodwhale.com to get more details on this risk warning and to explore further insights about STEEL DYNAMICS. More…
Peers
The steel industry is extremely competitive, with Steel Dynamics Inc. facing stiff competition from BCH JSC, KG Dongbusteel, Kalyani Steels Ltd, and other companies. Steel Dynamics Inc. has remained a strong competitor by investing in new technologies and expanding its production capabilities. The company has also been able to keep its costs low by utilizing its large scale and efficient operations.
– BCH JSC ($HNX:BCA)
Dongbu Steel is one of the largest steel manufacturers in South Korea. The company has a market cap of 895.02B as of 2022 and a return on equity of 17.61%. Dongbu Steel produces a wide range of steel products including hot and cold rolled steel, galvanized steel, stainless steel, and more. The company also has a large presence in the global market, with plants and offices in countries such as the United States, China, and India.
– KG Dongbusteel ($KOSE:016380)
Kalyani Steels Ltd is an Indian steel company with a market cap of 13.05 billion as of 2022. The company has a return on equity of 11.27%. The company produces a range of steel products including rebars, wire rods, and merchant products. The company has a strong presence in the Indian market and is expanding its operations in the international market.
Summary
Steel Dynamics is a stock that has held its own in the face of market dips. On the most recent trading day, the stock closed at $102.11, up 1.12% from the prior session. This is a sign that investors remain bullish on the company despite a volatile market. Analysts say that Steel Dynamics has a strong balance sheet and a low debt-to-equity ratio, making it an attractive investment.
Additionally, Steel Dynamics has a long history of dividend payments, which provide investors with a consistent income stream. Overall, Steel Dynamics remains a stock to watch for those looking for attractive returns in the current market environment.
Related Posts


Recent Posts


