Smartsheet Demonstrates Market Leadership With 81 RS Rating.
November 17, 2023

🌥️Trending News
Smartsheet Inc ($NYSE:SMAR). is a Seattle-based software company that provides cloud-based collaboration and project management services. Its products help users track tasks, manage team workflows and collaborate on projects across the globe. The company has recently demonstrated its market leadership with a strong 81 RS Rating, indicating a rise in stock performance. The RS Rating measures a stock’s price performance against that of other stocks with similar characteristics. A rating of 81 indicates that Smartsheet’s stock has outperformed 81% of all stocks in the same category, a strong sign of market leadership.
The RS Rating is one of many different indicators used to analyze Smartsheet’s stock performance. It has been widely used by investors in recent years to assess the short-term potential of a company’s stock. With such a strong rating, it is clear that Smartsheet has been able to establish itself as a market leader and is well-positioned for continued success in the future.
Market Price
Smartsheet Inc., the global leader in cloud-based collaboration and work management, has recently demonstrated its market leadership with an impressive 81 RS rating. On Thursday, its stock opened at $41.7 and closed at $40.9, down 2.5% from its prior closing price of 42.0. The RS rating is a testament to the company’s strong performance and growth potential, making it an attractive option for investors with an appetite for growth stocks. Live Quote…
About the Company
Income Snapshot
Below shows the total revenue, net income and net margin for Smartsheet Inc. More…
| Total Revenues | Net Income | Net Margin |
| 867.38 | -146.1 | -16.8% |
Cash Flow Snapshot
Below shows the cash from operations, investing and financing for Smartsheet Inc. More…
| Operations | Investing | Financing |
| 101.45 | -108.96 | 15.85 |
Balance Sheet Snapshot
Below shows the total assets, liabilities and book value per share for Smartsheet Inc. More…
| Total Assets | Total Liabilities | Book Value Per Share |
| 1.16k | 623.74 | 4.03 |
Key Ratios Snapshot
Some of the financial key ratios for Smartsheet Inc are shown below. More…
| 3Y Rev Growth | 3Y Operating Profit Growth | Operating Margin |
| 38.5% | – | -17.9% |
| FCF Margin | ROE | ROA |
| 10.2% | -18.5% | -8.3% |
Analysis
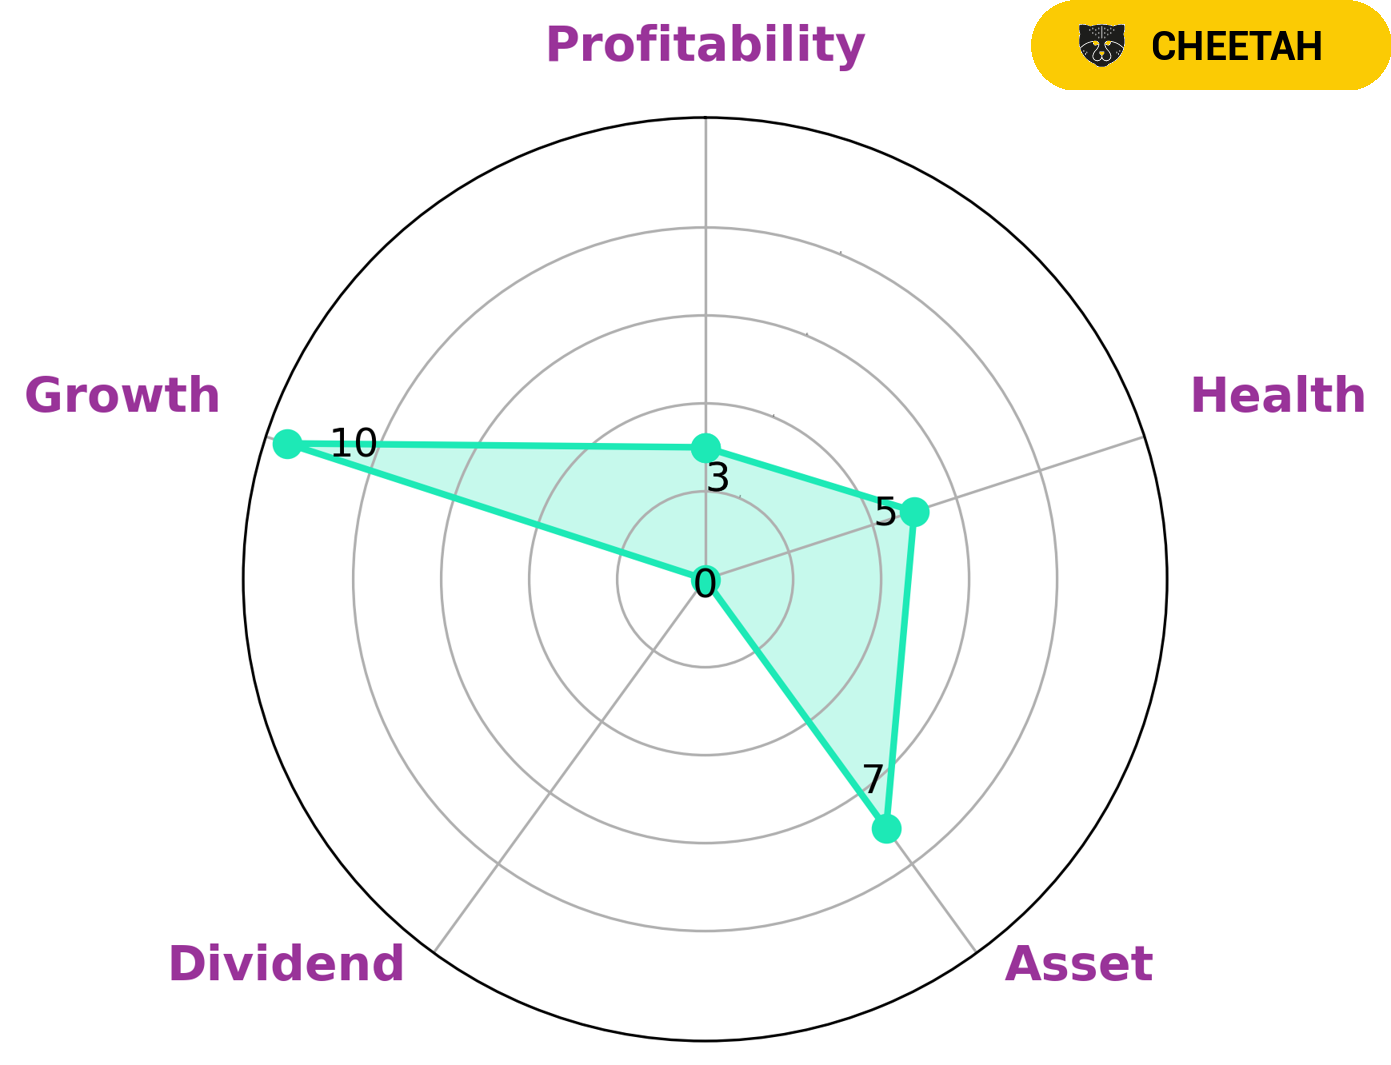
GoodWhale recently conducted an analysis of SMARTSHEET INC‘s wellbeing. The results of the Star Chart indicate that the company is strongest in asset and growth, but weakest in dividends and profitability. Overall, the company earned an intermediate health score of 5/10 with respect to its cashflows and debt, suggesting that it may be able to survive any crisis without the risk of bankruptcy. Based on this data, GoodWhale classified SMARTSHEET INC as a ‘cheetah’, a type of firm which has achieved high revenue or earnings growth but is deemed less stable due to lower profitability. As such, we believe that most investors interested in this company are likely to be those looking to invest in high-growth ventures, as well as those who are comfortable with taking on more risk. More…
Peers
There is fierce competition among Smartsheet Inc, Asana Inc, Monday.Com Ltd, and Microsoft Corp in the productivity software market. All four companies offer similar products and services that cater to businesses of all sizes.
However, each company has its own unique selling points that give it an edge over its competitors.
– Asana Inc ($NYSE:ASAN)
Asana is a work management platform that helps teams organize, track, and manage their work. It has a market cap of 3.98B as of 2022 and a Return on Equity of -184.09%. Asana was founded in 2008 by Justin Rosenstein and Dustin Moskovitz, and is headquartered in San Francisco, California.
– Monday.Com Ltd ($NASDAQ:MNDY)
Monday.com Ltd has a market cap of $4.38B as of 2022. The company has a Return on Equity of -16.76%. Monday.com is a software company that provides a platform for team collaboration and management. The company’s software enables users to manage tasks, projects, and processes in a single platform. Monday.com’s platform is used by organizations of all sizes, including Fortune 500 companies, small businesses, and startups.
– Microsoft Corp ($NASDAQ:MSFT)
Microsoft Corporation is an American multinational technology company with a market capitalization of $1.76 trillion as of April 2022 and a return on equity of 45.3%. The company develops, manufactures, licenses, supports, and sells computer software, consumer electronics, personal computers, and services. Its best known software products are the Microsoft Windows line of operating systems, the Microsoft Office suite, and the Internet Explorer and Edge web browsers.
Summary
SmartSheet Inc is a leading stock in the market showing signs of rising market leadership. It has recently earned an impressive 81 Relative Strength Rating, indicating that its stock price has increased significantly over the short-term. Analysts retain a positive outlook for SmartSheet as it has seen rising demand for its cloud-based platform for managing and automating business processes. The company has seen consistent revenue growth over several quarters and has also announced partnerships with multiple companies in the cloud-computing space, indicating further potential for growth in the future.
Related Posts


Recent Posts


