HUB GROUP Reports Higher-Than-Expected Earnings Per Share, Misses Revenue Estimate
April 28, 2023

Trending News ☀️
However, its revenue of $1.2 billion was $30 million short of the consensus estimate. The company has a broad portfolio of services including intermodal, truck brokerage, third-party logistics and supply chain solutions. With its expert team and advanced technologies, Hub Group ($NASDAQ:HUBG) is focused on delivering cost-effective and reliable services to customers across a variety of industries.
The company was able to report higher-than-expected earnings despite the revenue miss due to its strong cost management initiatives, which allowed it to deliver strong margins. Going forward, Hub Group remains confident that its strategic investments in technology and innovative services will continue to drive revenue growth and help position the company for long-term success.
Stock Price
On Thursday, HUB GROUP reported higher-than-expected earnings per share despite missing the revenue estimate. The stock opened at $78.1 and closed at $80.8, reflecting a 4.3% increase from the previous closing price of 77.5. The company’s results were driven by strong cost control measures which ensured that profits surpassed estimates despite a slight dip in revenues. HUB GROUP’s performance was further buoyed by their strategic acquisitions and optimization initiatives, which allowed them to capitalize on their existing strengths and expand their portfolio of services.
This strategic approach allowed them to remain competitive despite the challenging economic climate. Going forward, HUB GROUP is confident that their cost control measures, strategic partnerships, and continued focus on customer service will allow them to continue to deliver strong earnings results. Live Quote…
About the Company
Income Snapshot
Below shows the total revenue, net income and net margin for Hub Group. More…
| Total Revenues | Net Income | Net Margin |
| 5.34k | 356.95 | 6.7% |
Cash Flow Snapshot
Below shows the cash from operations, investing and financing for Hub Group. More…
| Operations | Investing | Financing |
| 458.16 | -278.87 | -52.46 |
Balance Sheet Snapshot
Below shows the total assets, liabilities and book value per share for Hub Group. More…
| Total Assets | Total Liabilities | Book Value Per Share |
| 2.81k | 1.21k | 48.15 |
Key Ratios Snapshot
Some of the financial key ratios for Hub Group are shown below. More…
| 3Y Rev Growth | 3Y Operating Profit Growth | Operating Margin |
| 13.3% | 46.0% | 8.9% |
| FCF Margin | ROE | ROA |
| 4.5% | 19.0% | 10.6% |
Analysis
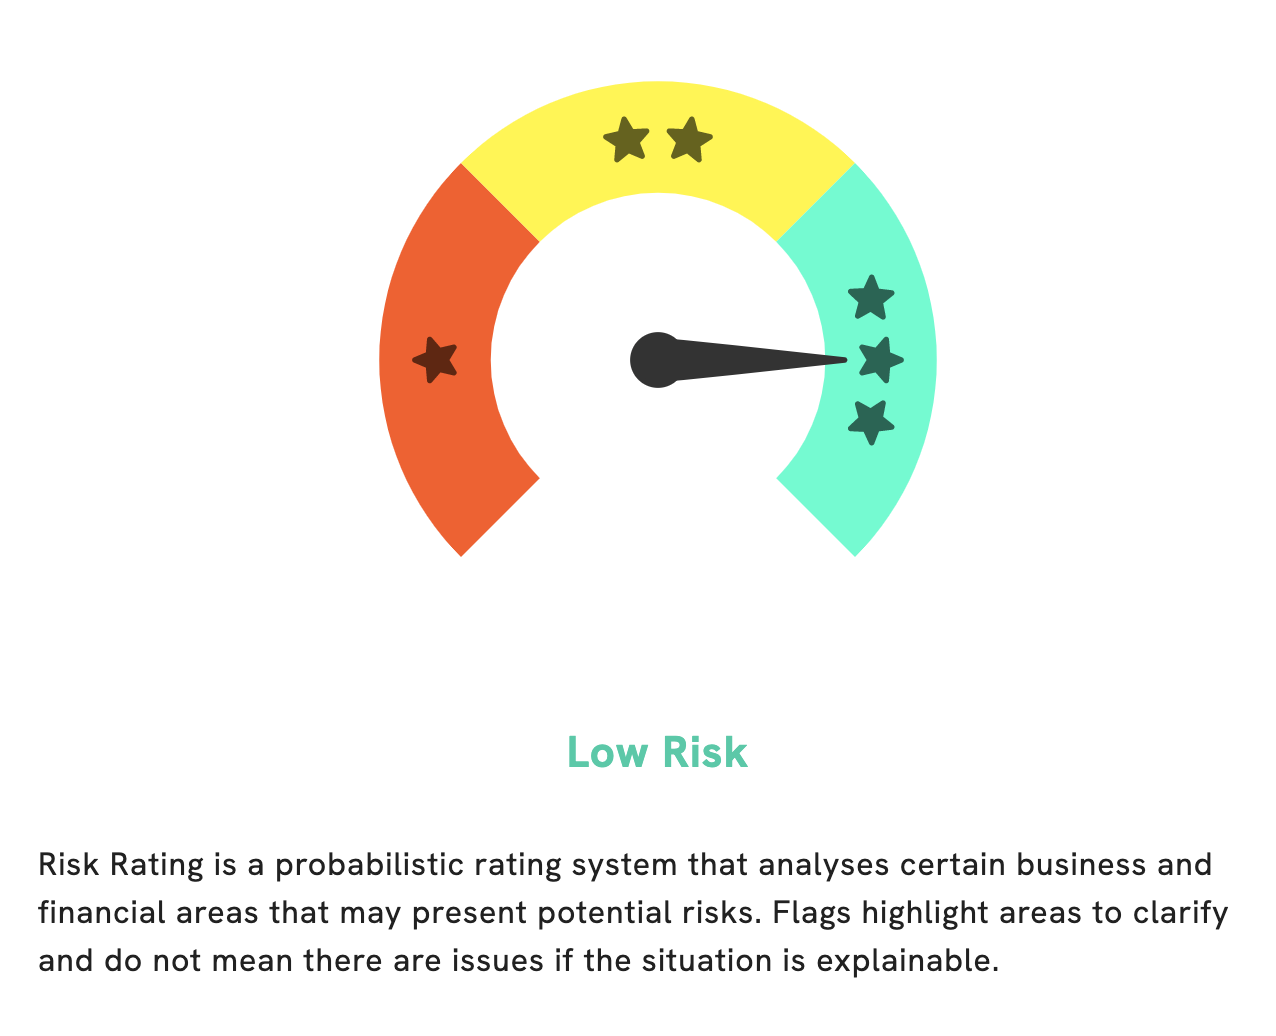
At GoodWhale, we recently completed a thorough analysis of the fundamentals of HUB GROUP. Our analysis found that while this stock is a low-risk investment in terms of financial and business aspects, there are some potential risks to be aware of. We found that HUB GROUP is in a good financial position, with strong cash flow and liquidity ratios. Their balance sheet is also in order, with manageable debt and equity levels. In addition, their business model appears to be relatively stable, with low turnover and customer loyalty. However, our analysis also revealed that there could be some potential risks to be aware of. This includes their customer concentration and the potential for disruption from new competitors. Additionally, we suggest monitoring their cash flow closely to ensure it is sufficient to cover all operating costs. We encourage any investor interested in HUB GROUP to register on goodwhale.com to further investigate these potential risks. Our reports provide detailed analysis on the financial and business areas that could have potential risk factors. More…
Peers
The competition in the logistics industry is fierce. Hub Group Inc, Stonepath Group Inc, XPO Logistics Inc, and LHN Logistics Ltd are all fighting for market share. Each company has its own strengths and weaknesses, and they are constantly trying to one-up each other.
– Stonepath Group Inc ($OTCPK:SGRZ)
The company’s market cap is $4.38k and its ROE is -2.67%. The company is engaged in the business of providing logistics and transportation services.
– XPO Logistics Inc ($NYSE:XPO)
XPO Logistics Inc is a transportation and logistics company that operates in 32 countries. It has a market cap of 5.27B and a ROE of 42.78%. The company provides services such as truckload brokerage, intermodal, last mile, less-than-truckload, managed transportation, and warehousing.
Summary
Hub Group, Inc. is a transportation management company that recently reported its fourth quarter results. The company reported GAAP earnings per share (EPS) of $1.88, which beat analyst estimates by $0.04. Revenue of $1.2B however, missed estimates by $30M.
Despite the revenue miss, investors were pleased with the earnings beat and the stock price moved up the same day. Moving forward, investors should consider the company’s past performance and future growth prospects when deciding whether to invest in Hub Group or not.
Related Posts


Recent Posts


