LifeMD, Beats Revenue Expectations with Non-GAAP EPS of $0.06 and $33M Revenue
May 13, 2023

Trending News 🌥️
LIFEMD ($NASDAQ:LFMD): LifeMD, Inc. is a publicly traded company on the NASDAQ Global Market, providing innovative products and services to the healthcare industry. The company’s mission is to reduce healthcare costs while increasing the quality of care by leveraging data-driven insights and AI-enabled automation. This includes providing patient-empowering wellness programs, telemedicine services, and analytics-supported patient care.
The company’s strong earnings report is a testament to its successful execution of its business plan. LifeMD, Inc. is well-positioned to capitalize on the growing demand for digital healthcare solutions and drive further growth moving forward.
Share Price
On Friday, the stock opened at $1.9 and closed at $1.8. This news had a positive reaction from investors, indicating strong confidence in the company’s financial performance. The rising stock prices reflect investor sentiment that LifeMD is on the right track to achieving their goals. With the positive results reported, LifeMD is proving to be a reliable investment for those looking to diversify their portfolios. Live Quote…
About the Company
Income Snapshot
Below shows the total revenue, net income and net margin for Lifemd. More…
| Total Revenues | Net Income | Net Margin |
| 119.03 | -48.64 | -36.4% |
Cash Flow Snapshot
Below shows the cash from operations, investing and financing for Lifemd. More…
| Operations | Investing | Financing |
| -22.94 | -13.91 | -0.53 |
Balance Sheet Snapshot
Below shows the total assets, liabilities and book value per share for Lifemd. More…
| Total Assets | Total Liabilities | Book Value Per Share |
| 25.67 | 32.97 | -0.22 |
Key Ratios Snapshot
Some of the financial key ratios for Lifemd are shown below. More…
| 3Y Rev Growth | 3Y Operating Profit Growth | Operating Margin |
| 112.1% | – | -33.3% |
| FCF Margin | ROE | ROA |
| -30.1% | 1683.2% | -96.6% |
Analysis
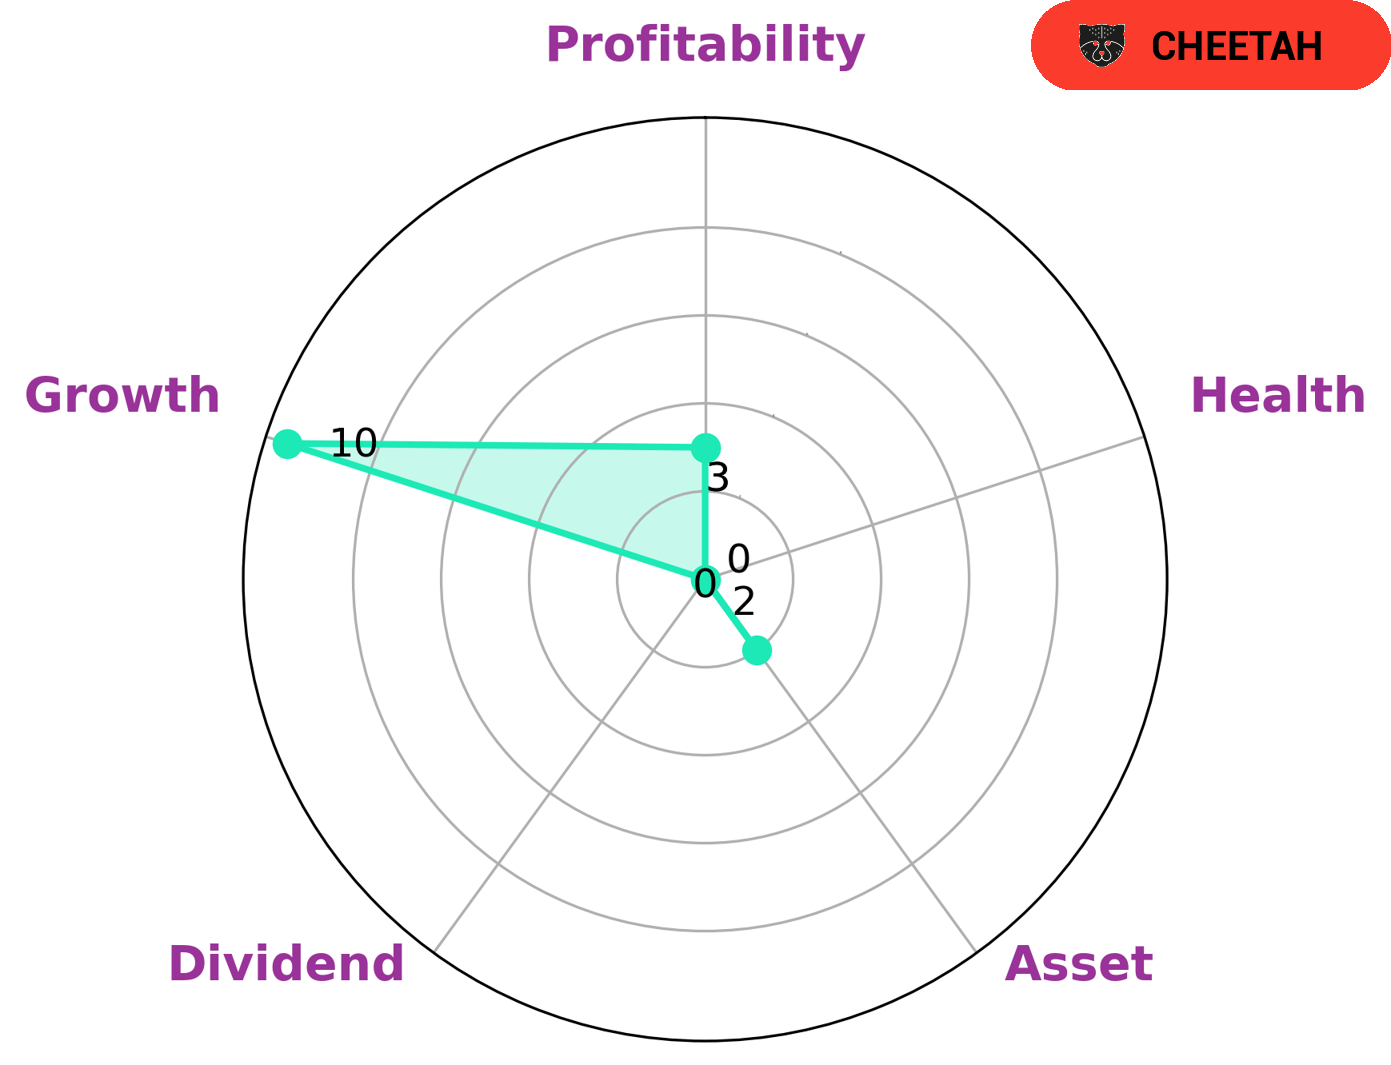
At GoodWhale, we recently conducted an analysis on the fundamentals of LIFEMD. Based on our Star Chart, we calculated a health score of 0/10, indicating that LIFEMD is less likely to pay off debt and fund future operations. Upon further investigation, we classified LIFEMD as a ‘cheetah’, a type of company that has achieved high revenue or earnings growth but at the same time is considered less stable due to lower profitability. Based on this analysis, we believe that LIFEMD would be of interest to investors looking for companies with high growth potential, but with an understanding of the associated risks. In particular, LIFEMD is strong in growth, yet weak in assets, dividends and profitability. Therefore, investors should understand these risks in order to make an informed decision. LifeMD_Beats_Revenue_Expectations_with_Non-GAAP_EPS_of_0.06_and_33M_Revenue”>More…
Peers
In the healthcare industry, there is intense competition between LifeMD Inc and its competitors: Cloud DX Inc, Neighbourly Pharmacy Inc, Mednow Inc. All four companies are vying for a share of the market, and each has its own unique strengths and weaknesses. LifeMD Inc has a strong presence in the online space, while Cloud DX Inc has a brick-and-mortar store that provides a more personal touch. Neighbourly Pharmacy Inc is known for its low prices, while Mednow Inc offers a convenient home delivery service.
– Cloud DX Inc ($TSXV:CDX)
DX is a Canadian company that provides digital marketing and technology solutions. Its solutions include website design and development, ecommerce, digital strategy, and online marketing. DX’s customers are typically small to medium-sized businesses in various industries.
As of 2022, DX had a market cap of $10.45 million and a return on equity of 111.76%. The company’s market cap is the value of its outstanding shares, and its return on equity is a measure of its profitability. DX’s high return on equity indicates that it is a profitable company.
– Neighbourly Pharmacy Inc ($TSX:NBLY)
As of 2022, Neighbourly Pharmacy Inc has a market cap of 1.03B and a return on equity of 0.85%. The company operates a chain of pharmacies in the United States.
– Mednow Inc ($TSXV:MNOW)
Mednow Inc is a healthcare technology company that provides online pharmacy and telemedicine services. The company has a market capitalization of $7.76 million and a return on equity of -57.05%. Mednow Inc was founded in 2014 and is headquartered in New York, New York.
Summary
LifeMD, Inc. reported a non-GAAP earnings per share (EPS) of $0.06 and revenue of $33 million in its latest quarterly earnings report. This was above analyst estimates, with the beat of $2.19 million being a notable point of strength. Investors may be pleased with the company’s strong performance and should consider the stock as a potential investment opportunity. LifeMD’s balance sheet also looks positive, and its financial metrics remain on a strong upward trajectory, suggesting that the company has plenty of room to grow in the future.
Related Posts


Recent Posts


