Archer-daniels-midland Company Stock Fair Value – ADM’s Return on Capital Shows Promising Trend
August 14, 2023

☀️Trending News
ARCHER-DANIELS-MIDLAND ($NYSE:ADM): Recently, ADM’s return on capital has been trending upward, showing that it is a strong investment opportunity. By tracking the return on capital of ADM, investors can see how efficiently the company is using its resources and how successful it has been in generating revenue. The return on capital measures the financial performance of an investment based on how much money it has generated relative to the amount of money it has invested in the project. Over the past year, ADM’s return on capital has been increasing steadily, showing that the company is using its resources more effectively and has been able to generate more revenue from each dollar invested.
The promising trend in ADM’s return on capital is a great sign for current and potential investors, as it shows that the company is well-positioned for growth and success in the future. As ADM continues to increase its return on capital, investors can be assured that their investments are in good hands and that they will be rewarded with excellent returns in the years to come.
Market Price
It appears that ARCHER-DANIELS-MIDLAND COMPANY (ADM) is continuing its upward trend in stock prices and return on capital. On Friday, the stock opened at $85.5 and closed at $85.6, up 0.7% from its previous closing price of 85.0. This trend is a positive indicator of the company’s continued success in terms of increasing returns on capital.
The stock’s performance indicates that investors are confident in ADM’s continued growth and potential. It is likely that ADM will continue to see an increase in stock prices and return on capital in the near future. Live Quote…
About the Company
Income Snapshot
Below shows the total revenue, net income and net margin for Archer-daniels-midland Company. More…
| Total Revenues | Net Income | Net Margin |
| 99.88k | 4.15k | 4.2% |
Cash Flow Snapshot
Below shows the cash from operations, investing and financing for Archer-daniels-midland Company. More…
| Operations | Investing | Financing |
| 5.05k | -1.36k | -6.12k |
Balance Sheet Snapshot
Below shows the total assets, liabilities and book value per share for Archer-daniels-midland Company. More…
| Total Assets | Total Liabilities | Book Value Per Share |
| 55.5k | 30.22k | 46.53 |
Key Ratios Snapshot
Some of the financial key ratios for Archer-daniels-midland Company are shown below. More…
| 3Y Rev Growth | 3Y Operating Profit Growth | Operating Margin |
| 15.8% | 32.3% | 5.5% |
| FCF Margin | ROE | ROA |
| 3.6% | 13.9% | 6.2% |
Analysis – Archer-daniels-midland Company Stock Fair Value
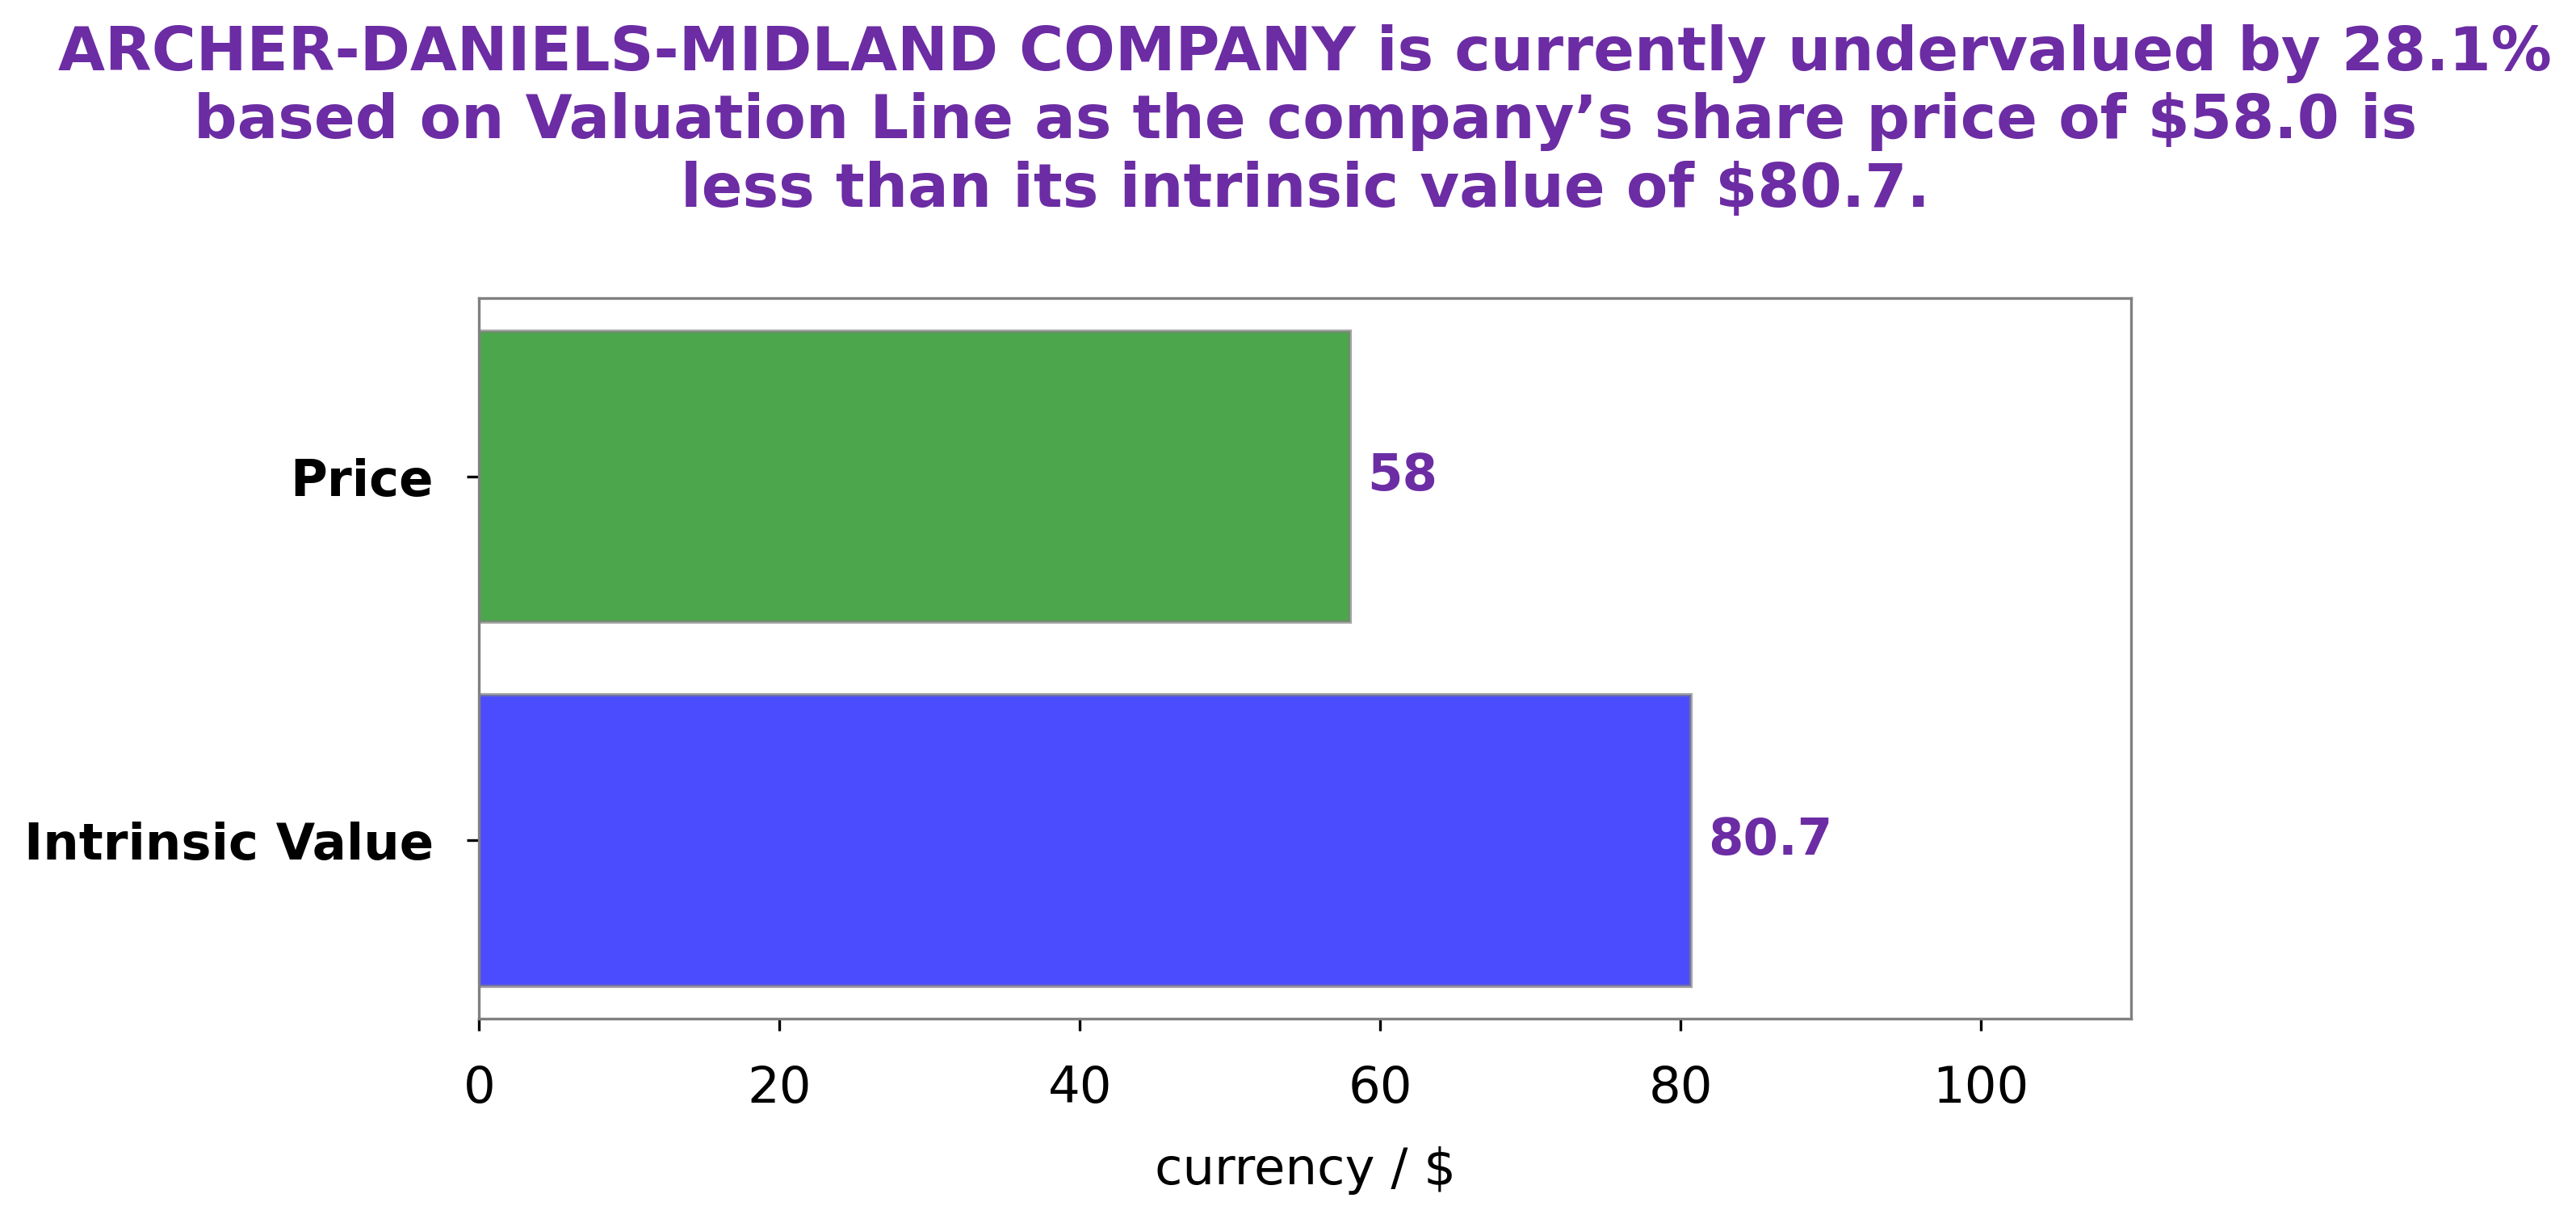
GoodWhale has completed an assessment of ARCHER-DANIELS-MIDLAND COMPANY‘s fundamentals and determined the intrinsic value of its share to be around $84.1. This was calculated using our proprietary Valuation Line which is based on a wide range of factors such as revenue growth rate, profit margin, and debt to equity ratio. Currently, the share is trading at $85.6 – a fair price that is slightly overvalued by 1.8%. Therefore, we recommend that investors should exercise caution when deciding whether to buy or sell this stock. More…
Peers
The Archer-Daniels Midland Co is in competition with Darling Ingredients Inc, Vilmorin & Cie, and Golden Growers Coop. All four companies produce food ingredients and additives. Archer-Daniels Midland Co has an edge over its competitors because it is the largest producer of corn sweeteners and corn oil in the United States.
– Darling Ingredients Inc ($NYSE:DAR)
Darling Ingredients Inc has a market cap of 12.59B as of 2022, a Return on Equity of 16.72%. Darling is in the business of turning animal by-products into renewable ingredients for the food, feed, fuel, and other industries. The company operates in three segments: Feed Ingredients, Food Ingredients, and Fuel Ingredients.
– Vilmorin & Cie ($LTS:0HJC)
Vilmorin & Cie is a French multinational agricultural and horticultural company. It is the world’s fourth-largest seed company. The company has a market cap of 1.03B as of 2022 and a Return on Equity of 7.29%. The company specializes in the production of seeds for a range of crops, including vegetables, fruits, cereals, and forage plants. The company also provides agricultural services, such as crop consulting, soil analysis, and irrigation design.
Summary
Archer-Daniels-Midland (ADM) has shown a promising trend in its Return on Capital (ROC). ADM has strengthened its balance sheet and increased liquidity, reducing its debt and increasing its cash reserves. Its operating performance has also improved, with the company being able to reduce its cost base which has allowed it to be more competitive and increase margins. The company has also increased its market share in segments where it has seen success.
Its operating cash flow has also increased, which has helped ADM invest in its businesses and increase its ability to generate returns on capital. Overall, ADM appears to be in a strong position to continue to generate returns on capital and grow its business.


