Stantec Stock Price Breaks Above 200-Day Moving Average of $70.98
May 3, 2023

Trending News 🌥️
Stantec Inc ($TSX:STN)., a leading global design and engineering firm, was in the headlines on Friday as its stock price surged past the 200-day moving average of $70.98. This momentum was further bolstered by an upbeat outlook from the company, which saw its full-year revenue projections exceed its previous guidance. The fact that Stantec’s stock price broke above the 200-day moving average is a sign of strength and indicates that investors are increasingly bullish on the company’s prospects. With its broad range of services and deep expertise, Stantec is well-positioned to capitalize on the multi-billion dollar global infrastructure market, which is projected to experience strong growth in the coming years. This recent surge in Stantec’s stock price could be an opportunity for investors to capitalize on the company’s potential for long-term growth.
However, investors should also be mindful of market conditions and weigh the risks before making any investment decisions.
Price History
On Monday, STANTEC INC stock opened at CA$81.6 and closed at CA$81.8, representing an increase of 0.5% from the previous closing price of 81.4. This closing price breaks above the 200-day moving average of $70.98, a positive development for the company and its shareholders. This milestone is a great indicator of the increasing value and potential of STANTEC INC as its stock continues to rise. Live Quote…
About the Company
Income Snapshot
Below shows the total revenue, net income and net margin for Stantec Inc. More…
| Total Revenues | Net Income | Net Margin |
| 5.68k | 247 | 4.3% |
Cash Flow Snapshot
Below shows the cash from operations, investing and financing for Stantec Inc. More…
| Operations | Investing | Financing |
| 304.3 | -73.8 | -296.7 |
Balance Sheet Snapshot
Below shows the total assets, liabilities and book value per share for Stantec Inc. More…
| Total Assets | Total Liabilities | Book Value Per Share |
| 5.65k | 3.37k | 20.63 |
Key Ratios Snapshot
Some of the financial key ratios for Stantec Inc are shown below. More…
| 3Y Rev Growth | 3Y Operating Profit Growth | Operating Margin |
| 5.6% | 5.4% | 7.0% |
| FCF Margin | ROE | ROA |
| 4.0% | 11.0% | 4.4% |
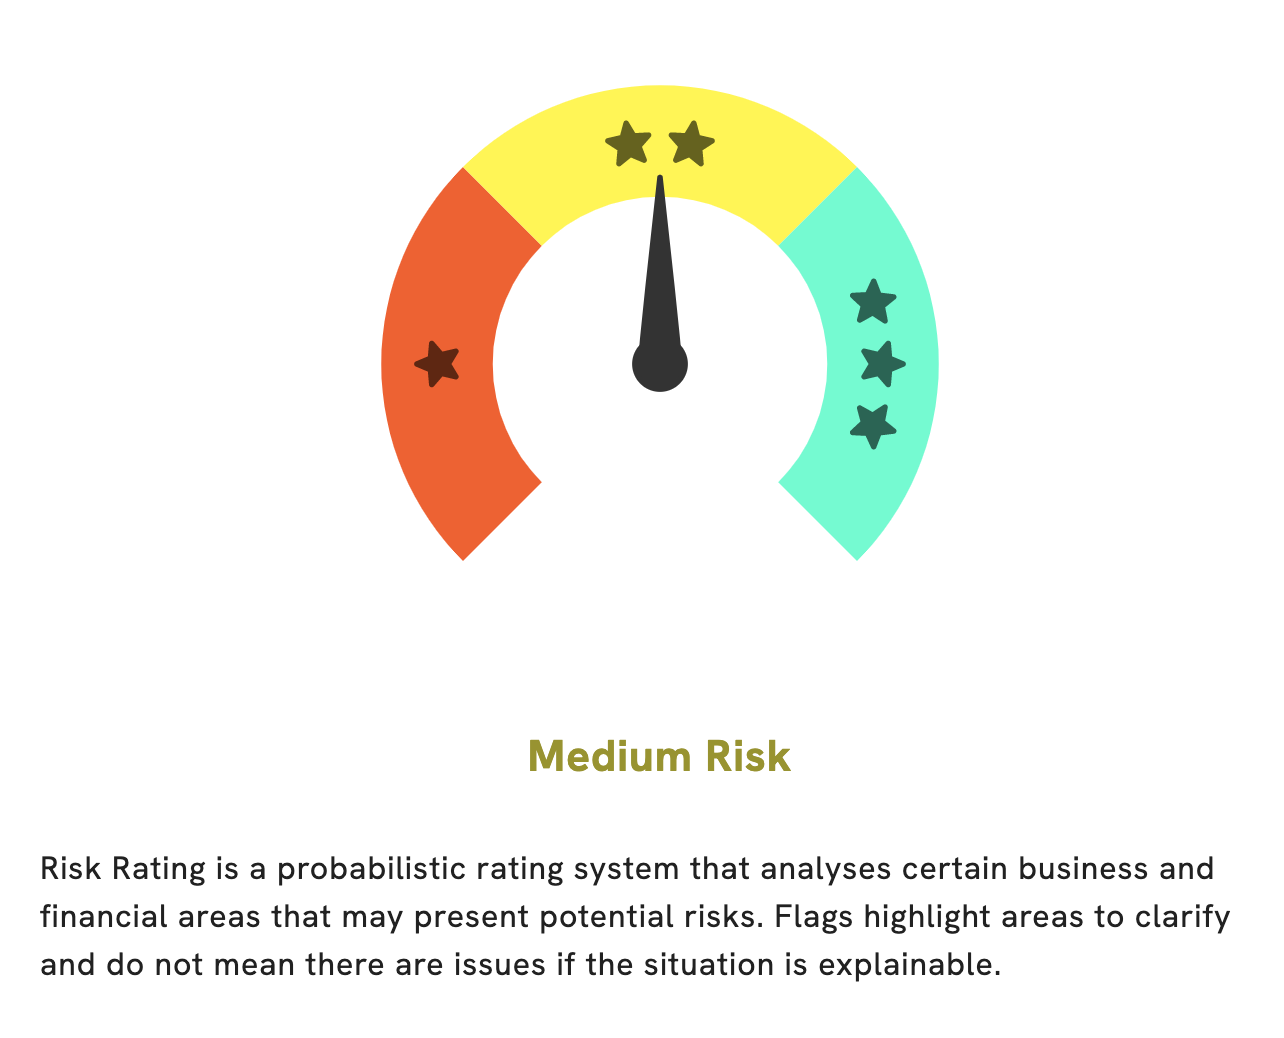
Analysis
At GoodWhale, we performed a comprehensive analysis of STANTEC INC‘s fundamentals to help investors make the best decision. After a thorough examination, we concluded that STANTEC INC is a medium risk investment. In terms of financial risk, we believe that potential investors should be aware of the three risk warnings in their income sheet, balance sheet, and non financial information. If you would like to learn more about the analysis we conducted and the risk warnings in more detail, we invite you to register with us. With your registration, you will gain insight into the financial and business aspects of STANTEC INC that we have evaluated, allowing you to make the most informed decision possible. More…
Peers
The company has a strong presence in North America and Europe and has completed many large-scale projects. Stantec’s competitors include Team Consulting Engineering and Management PCL, JSTI Group, and Dhruv Consultancy Services Ltd. All of these companies are large, well-established firms with a strong track record in the engineering and construction industry.
– Team Consulting Engineering and Management PCL ($SZSE:300284)
With a market cap of 7.2B as of 2022 and a return on equity of 5.66%, JSTI Group is a publicly traded company that provides various services including but not limited to engineering, construction, and project management. The company has a wide range of clients including government agencies and private companies. JSTI Group has been in business for over 50 years and has a strong reputation in the engineering and construction industry.
– JSTI Group ($BSE:541302)
Dhruv Consultancy Services Ltd is an engineering consultancy firm based in India. The company has a market capitalisation of 889.15 million as of 2022 and a return on equity of 10.73%. The company provides engineering and project management services to clients in the oil and gas, power, and infrastructure sectors. The company has offices in Mumbai, Delhi, Pune, and Bangalore.
Summary
Stantec Inc.’s stock price surged above its 200-day moving average of $70.98 during trading on Friday, a milestone for the company’s investors. All in all, Stantec Inc. offers long-term investors good prospects for strong returns.


