Yeti Holdings Stock Fair Value – YETI HOLDINGS Reports Q2 FY2023 Earnings Results for June 30 2023
August 25, 2023

🌥️Earnings Overview
YETI HOLDINGS ($NYSE:YETI) announced their second quarter FY2023 earnings, ending June 30 2023. The total revenue for the period was USD 402.6 million, a decrease of 4.2% compared to the same quarter of the previous year. Net income for the quarter dropped 17.7% year-on-year to USD 38.1 million.
Market Price
On Thursday, YETI HOLDINGS reported their Q2 FY2023 earnings results for June 30, 2023. Their stock opened the day at $45.5 and closed at $46.4, representing a soar of 17.3% from the prior closing price of $39.6. The impressive surge in YETI HOLDINGS stock is attributed to the company’s announcement of profitable Q2 results. These strong financial results are indicative of the company’s ability to capitalize on the current market conditions and its solid strategy for growth. The company has been able to capitalize on the outdoor and sporting goods industry’s increasing demand for quality products and its innovative approach to product development.
This has helped YETI HOLDINGS to gain market share and position itself as a leader in the industry. Overall, YETI HOLDINGS’ Q2 earnings results are a clear indication of the strength of their business model and the solidity of their financial position. This news has been welcomed by investors as it provides them with a picture of the future potential of the company’s stock and its outlook going forward. Live Quote…
About the Company
Income Snapshot
Below shows the total revenue, net income and net margin for Yeti Holdings. More…
| Total Revenues | Net Income | Net Margin |
| 1.59k | 66.42 | 4.2% |
Cash Flow Snapshot
Below shows the cash from operations, investing and financing for Yeti Holdings. More…
| Operations | Investing | Financing |
| 204.24 | -57 | -18.8 |
Balance Sheet Snapshot
Below shows the total assets, liabilities and book value per share for Yeti Holdings. More…
| Total Assets | Total Liabilities | Book Value Per Share |
| 1.09k | 498.23 | 6.77 |
Key Ratios Snapshot
Some of the financial key ratios for Yeti Holdings are shown below. More…
| 3Y Rev Growth | 3Y Operating Profit Growth | Operating Margin |
| 18.7% | -6.0% | 5.7% |
| FCF Margin | ROE | ROA |
| 9.3% | 10.0% | 5.2% |
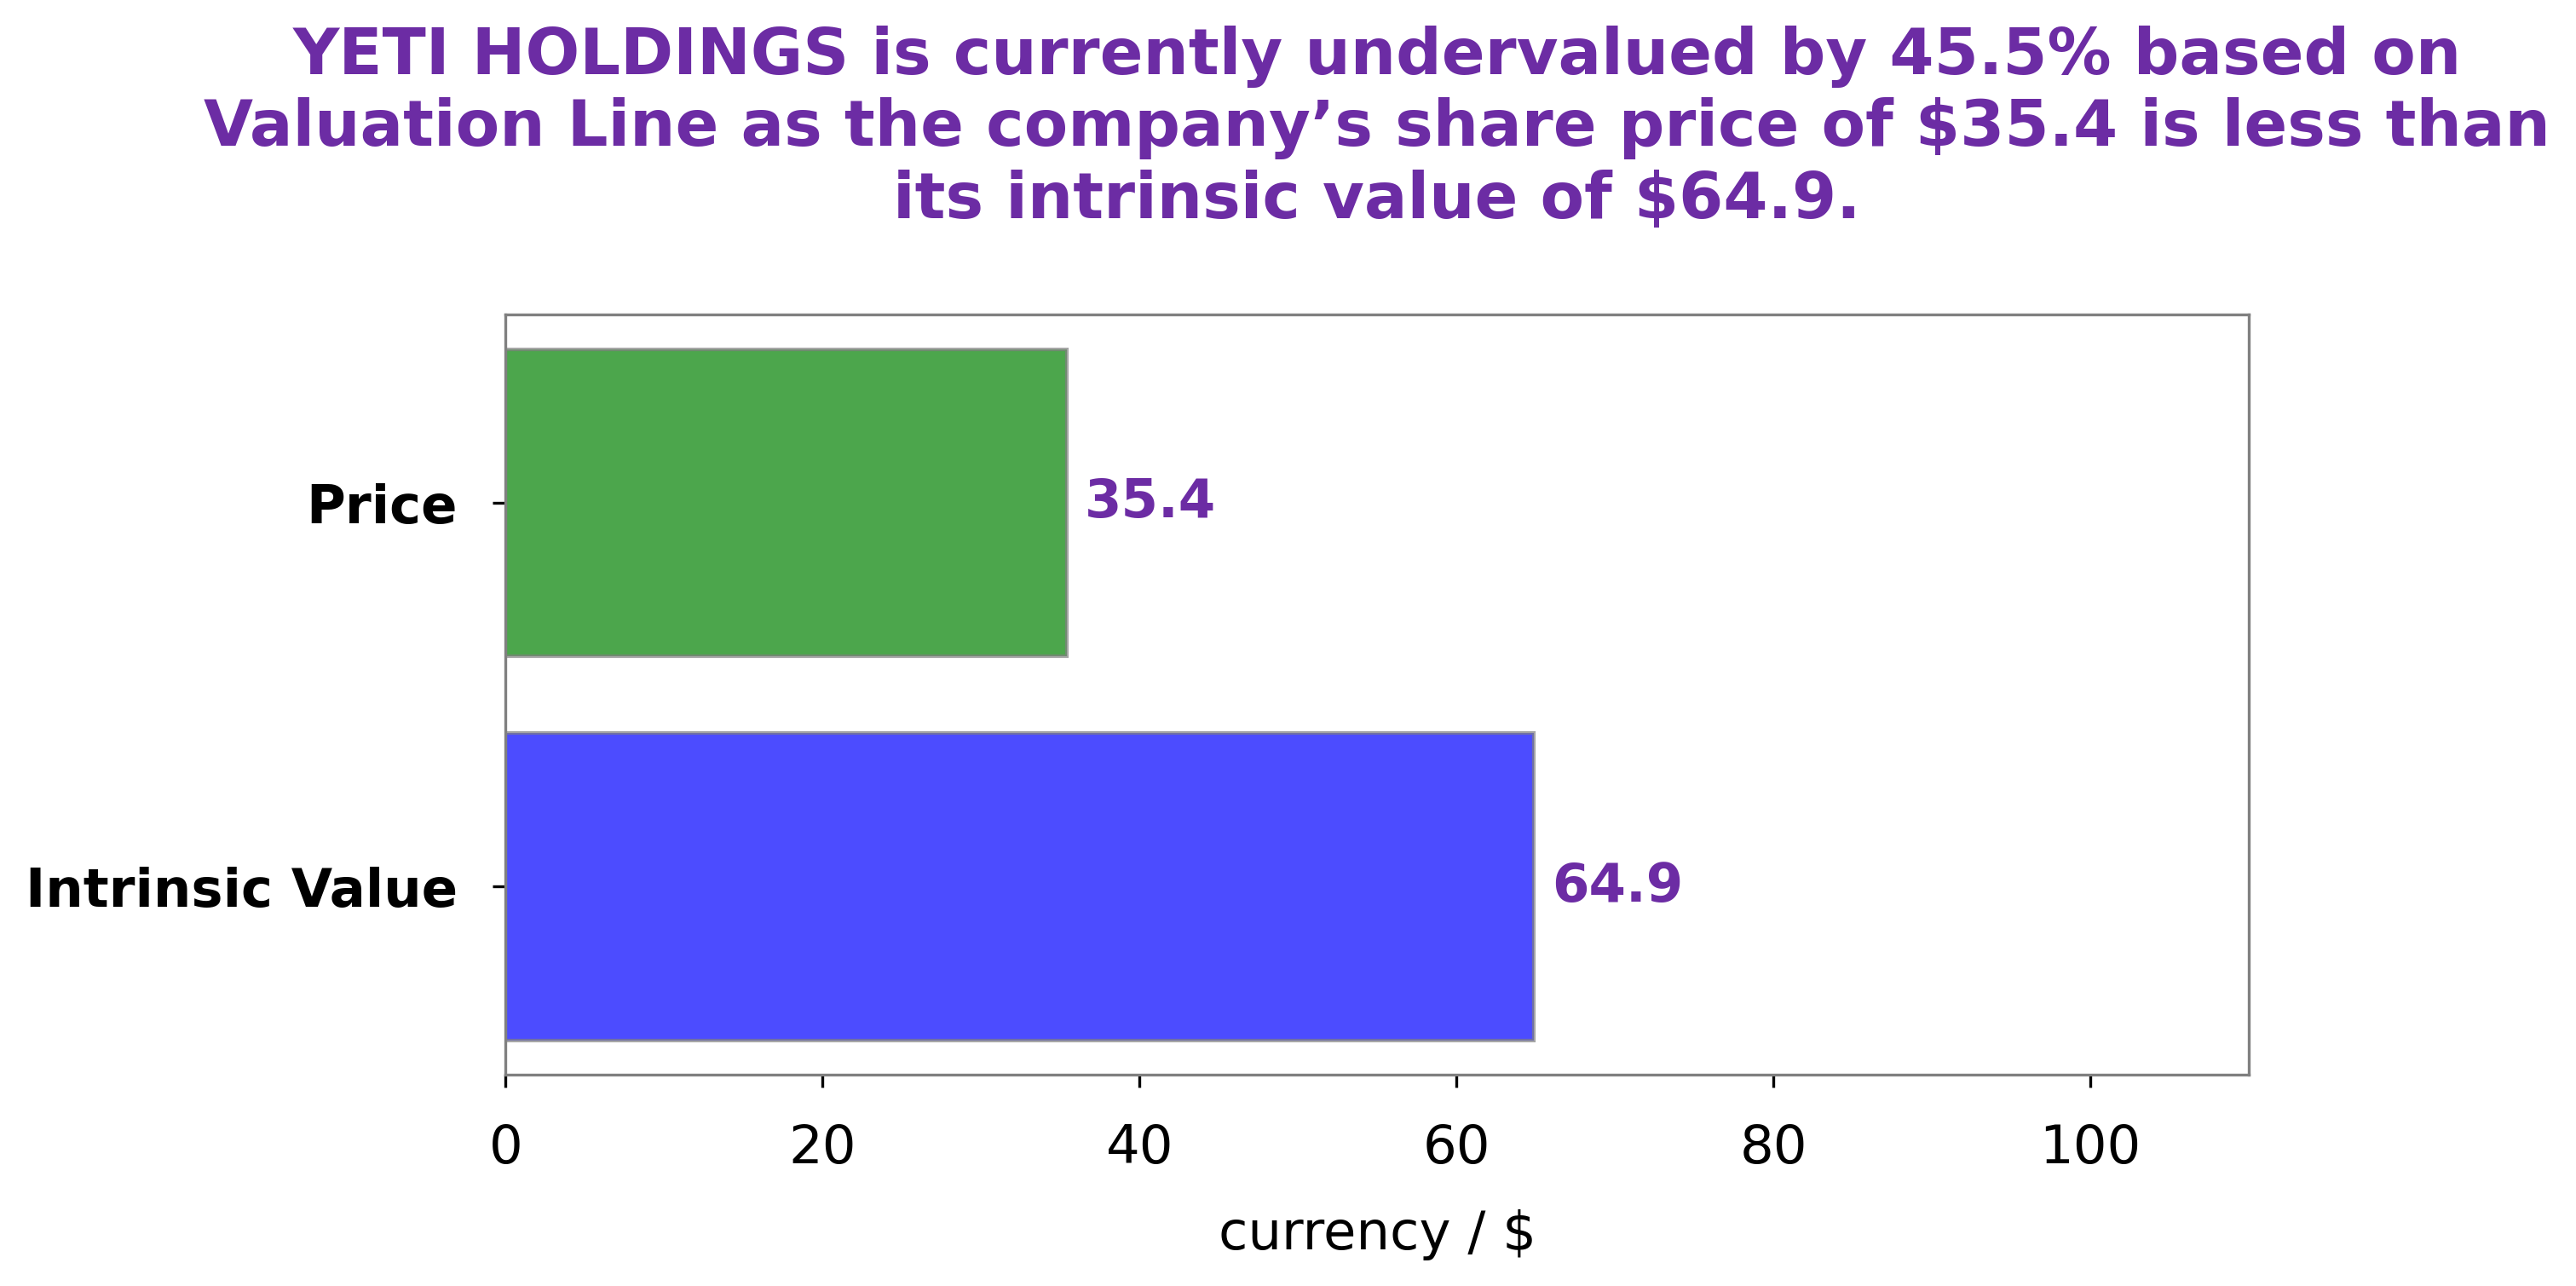
Analysis – Yeti Holdings Stock Fair Value
At GoodWhale, we recently conducted an in-depth analysis of YETI HOLDINGS‘ fundamentals. After careful consideration of the company’s financial reports, debt structure, industry outlook and other factors, we have determined that the intrinsic value of YETI HOLDINGS’ shares is around $70.3, calculated by our proprietary Valuation Line. At the time of writing, YETI HOLDINGS stock is being traded at $46.4. This implies that the stock is undervalued by 34.0% and represents an attractive buying opportunity for investors. More…
Peers
In recent years, the competition between YETI Holdings Inc and its competitors has intensified, as each company strives to gain market share in the highly competitive cooler and drinkware industry. While YETI has long been the market leader, its competitors are quickly catching up, offering products that are comparable in quality and price. As the competition heats up, it will be interesting to see which company comes out on top.
– Tandem Group PLC ($LSE:TND)
Tandem Group PLC is a holding company that engages in the design, manufacture, and distribution of bicycles and bicycle related products. The company operates through the following segments: Bicycles, Components, and Others. The Bicycles segment designs, manufactures, and sells complete bicycles, electric bicycles, and folding bicycles. The Components segment manufactures and sells bicycle components and wheels. The Others segment includes the group’s online retailing business. Tandem Group was founded by Frank Bowden in 1885 and is headquartered in Coventry, the United Kingdom.
– Bonny Worldwide Ltd ($TWSE:8467)
Bonny Worldwide Ltd is a publicly traded company with a market capitalization of 2.57 billion as of 2022. The company has a return on equity of 16.57%. Bonny Worldwide Ltd is engaged in the business of providing offshore oil and gas services. The company has a fleet of offshore support vessels that it uses to provide services to the oil and gas industry.
– Bollinger Industries Inc ($OTCPK:BOLL)
Bollinger Industries Inc is a publicly traded company with a market capitalization of 262.12k. The company manufactures and sells a variety of products, including electric vehicles, towing products, and other related accessories. Bollinger Industries was founded in 1984 and is headquartered in New York, New York.
Summary
YETI HOLDINGS reported their earnings results for the second quarter of FY2023, revealing that total revenue for the quarter was USD 402.6 million, a decrease of 4.2% from the same period of the previous year. Net income for the quarter was USD 38.1 million, a decrease of 17.7%. Despite this, the stock price of YETI HOLDINGS moved up the same day, indicating that investors may be confident in the company’s long-term performance and potential for growth. Investors should keep an eye on the company’s performance in the upcoming quarters to determine whether the stock price will remain at these levels or if there may be a dip in value.


