X Intrinsic Value Calculator – U.S. Steel Announces Second Quarter Financial Results for Fiscal Year 2023
August 26, 2023

🌥️Earnings Overview
UNITED ($NYSE:X): On July 27 2023, U.S. Steel reported their financial results for the quarter ending June 30 2023, revealing revenue of USD 5008.0 million – a drop of 20.4% year on year – and net income of USD 477.0 million – a decrease of 51.2% compared to the same period in the fiscal year 2022.
Share Price
The company’s stock opened at $25.8 and closed at $25.0, down 2.5% from its last closing price of $25.7. U.S. Steel’s CEO David Burritt noted that “We delivered strong performance in the second quarter driven by higher steel shipments and improved pricing compared to the prior quarter and year-ago period.” Overall, U.S. Steel reported strong results for the second quarter, with revenues and profits both increasing year-over-year. The company is continuing to advance its cost reduction initiatives and focus on its long-term strategic plan, which should drive further value for shareholders in the coming quarters. Live Quote…
About the Company
Income Snapshot
Below shows the total revenue, net income and net margin for X. More…
| Total Revenues | Net Income | Net Margin |
| 19.02k | 1.34k | 7.0% |
Cash Flow Snapshot
Below shows the cash from operations, investing and financing for X. More…
| Operations | Investing | Financing |
| 2.72k | -2.43k | -294 |
Balance Sheet Snapshot
Below shows the total assets, liabilities and book value per share for X. More…
| Total Assets | Total Liabilities | Book Value Per Share |
| 20.31k | 9.49k | 47.36 |
Key Ratios Snapshot
Some of the financial key ratios for X are shown below. More…
| 3Y Rev Growth | 3Y Operating Profit Growth | Operating Margin |
| 21.0% | 64.7% | 9.8% |
| FCF Margin | ROE | ROA |
| 1.4% | 11.0% | 5.7% |
Analysis – X Intrinsic Value Calculator
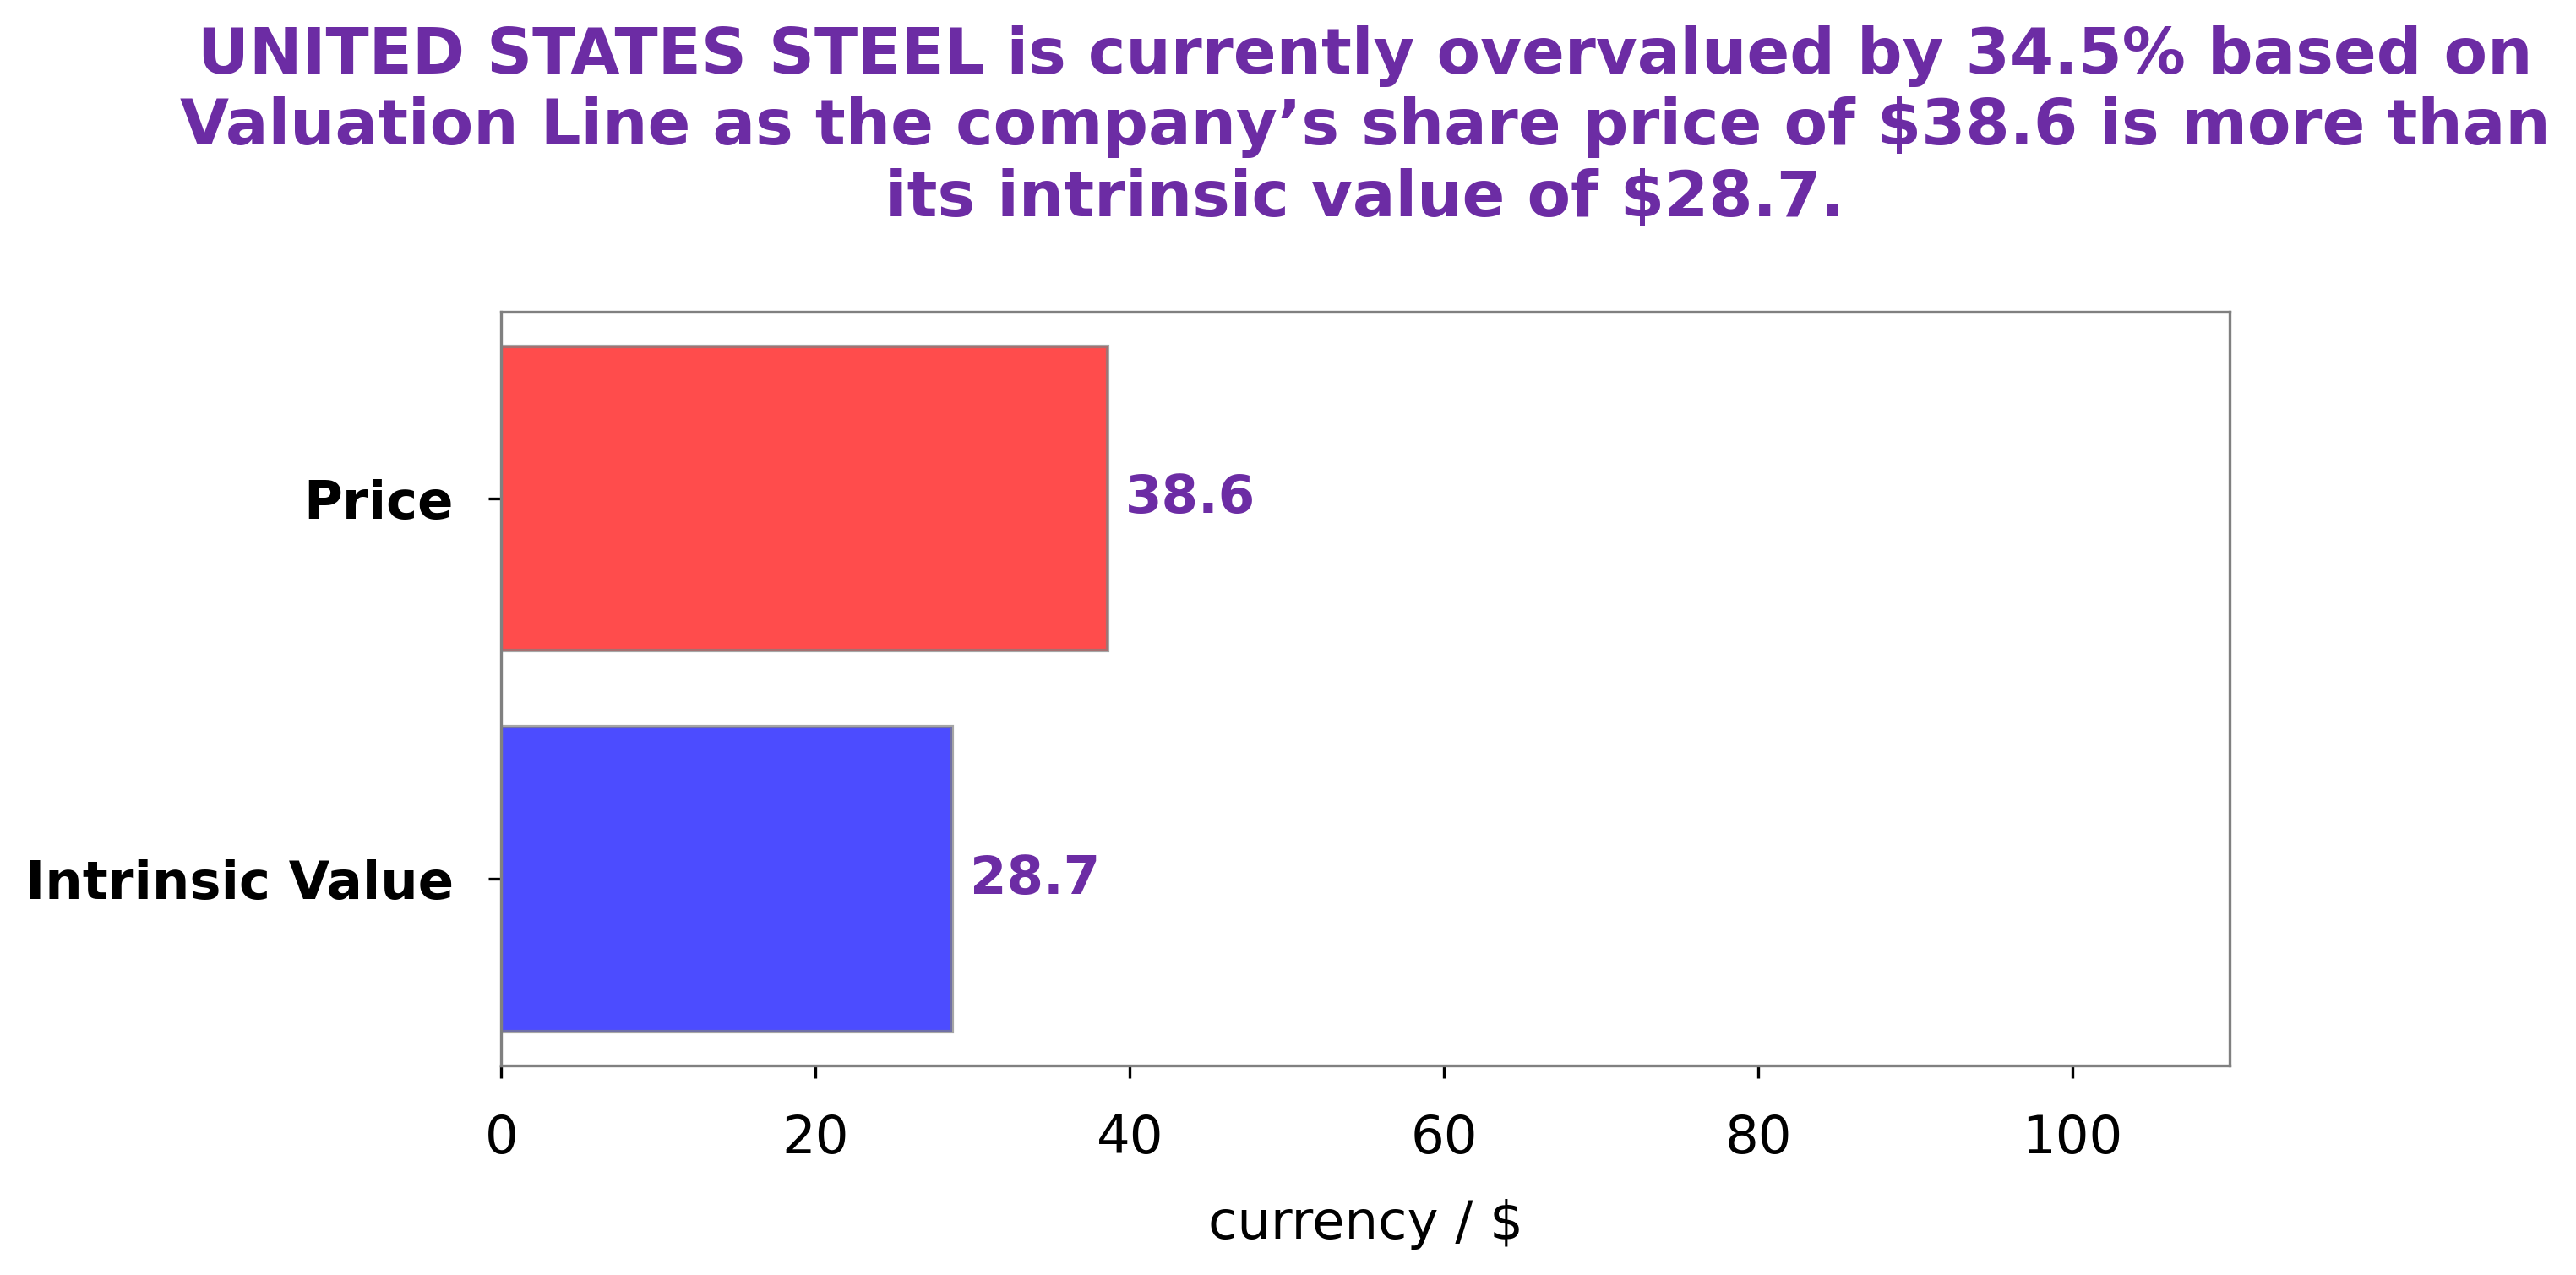
At GoodWhale, we recently analyzed the financials of UNITED STATES STEEL and used our proprietary Valuation Line to evaluate its fair value. Our calculations show that the fair value of UNITED STATES STEEL share is around $27.2, a fair price that is currently undervalued by 7.9%. Currently, UNITED STATES STEEL stock is traded at $25.0, an attractive buy opportunity for investors looking to take advantage of this discrepancy. We believe that UNITED STATES STEEL is a solid long-term investment as it has consistently reported positive financial results over the years. More…
Peers
United States Steel Corp, Cleveland-Cliffs Inc, Algoma Steel Group Inc, and Ternium SA are all steel companies that compete for market share. While U.S. Steel is the largest of the four, the other three are not far behind in terms of size and operations. All four companies have a long history in the steel industry and are well-positioned to compete for business in the coming years.
– Cleveland-Cliffs Inc ($NYSE:CLF)
Cleveland-Cliffs Inc is an American mining and natural resources company. The company is the largest producer of iron ore pellets in North America, and a major supplier of direct-reduced iron (DRI) globally. The company also produces other iron-related products, such as metallurgical coal and ferroalloys. It has operations in the United States, Canada, Brazil, and Australia.
Cleveland-Cliffs Inc has a market cap of 8.45B as of 2022. The company’s return on equity is 46.25%. Cleveland-Cliffs Inc is the largest producer of iron ore pellets in North America and a major supplier of direct-reduced iron globally. The company also produces other iron-related products, such as metallurgical coal and ferroalloys.
– Algoma Steel Group Inc ($TSX:ASTL)
Algoma Steel Group Inc is a Canadian steel company located in Sault Ste. Marie, Ontario. The company has a market cap of 1B as of 2022 and a return on equity of 57.58%. The company produces steel products for the construction, energy, manufacturing, and transportation industries.
– Ternium SA ($NYSE:TX)
Ternium SA is a leading steel producer in Latin America with operations in Mexico, Argentina, Chile, Colombia, Guatemala and the United States. The company has a market cap of 5.66B as of 2022 and a Return on Equity of 30.03%. Ternium is the largest integrated steel producer in Latin America and the third largest in the world, with a production capacity of approximately 21 million tons of crude steel per year. The company produces a wide range of steel products, including flat and long products, coated products, and specialty steels. Ternium’s products are used in a variety of industries, such as construction, automotive, appliances, packaging, and others.
Summary
United States Steel Corporation reported a 20.4% decrease in revenue for the second quarter of 2023, ending June 30, compared to the same period last year. Net income decreased 51.2% to USD 477 million. Investors should take into account the decreased revenue and net income when considering investing in the company.
Analysts should also consider the competitive landscape of the steel industry, from which U.S. Steel derives its revenue and profits. Moreover, it is important to consider the company’s long-term financial health and outlook, as well as how potential changes in the global economy may impact its operations.


