WINNEBAGO INDUSTRIES Reports FY2024 Q1 Earnings Results as of November 30 2023
December 28, 2023

🌥️Earnings Overview
On December 20 2023, WINNEBAGO INDUSTRIES ($NYSE:WGO) released their fiscal year 2024 first-quarter earnings report which included total revenue of USD 763.0 million, a 19.9% decrease from the same period in the previous year. Net income was also down 57.1%, totaling USD 25.8 million.
Price History
WINNEBAGO INDUSTRIES reported its fiscal year 2024 Q1 earnings results on Wednesday, November 30 2023. At the opening bell, the stock was valued at $70.5 and closed at $71.0, a decrease of 5.6% from its prior closing price of $75.1.
Additionally, the company is also planning to use the funds to pay off existing debt and provide additional liquidity. Looking ahead, WINNEBAGO INDUSTRIES is confident that their strategies and initiatives will be successful and continue to drive growth and profitability in the years to come. With strong financials and strategic investments, the company looks forward to an exciting future as a leader in the RV industry. Live Quote…
About the Company
Income Snapshot
Below shows the total revenue, net income and net margin for Winnebago Industries. More…
| Total Revenues | Net Income | Net Margin |
| 3.3k | 181.5 | 5.5% |
Cash Flow Snapshot
Below shows the cash from operations, investing and financing for Winnebago Industries. More…
| Operations | Investing | Financing |
| 243.2 | -157.6 | -137.7 |
Balance Sheet Snapshot
Below shows the total assets, liabilities and book value per share for Winnebago Industries. More…
| Total Assets | Total Liabilities | Book Value Per Share |
| 2.37k | 1.01k | 45.28 |
Key Ratios Snapshot
Some of the financial key ratios for Winnebago Industries are shown below. More…
| 3Y Rev Growth | 3Y Operating Profit Growth | Operating Margin |
| 8.8% | 13.2% | 7.7% |
| FCF Margin | ROE | ROA |
| 5.3% | 11.6% | 6.7% |
Analysis
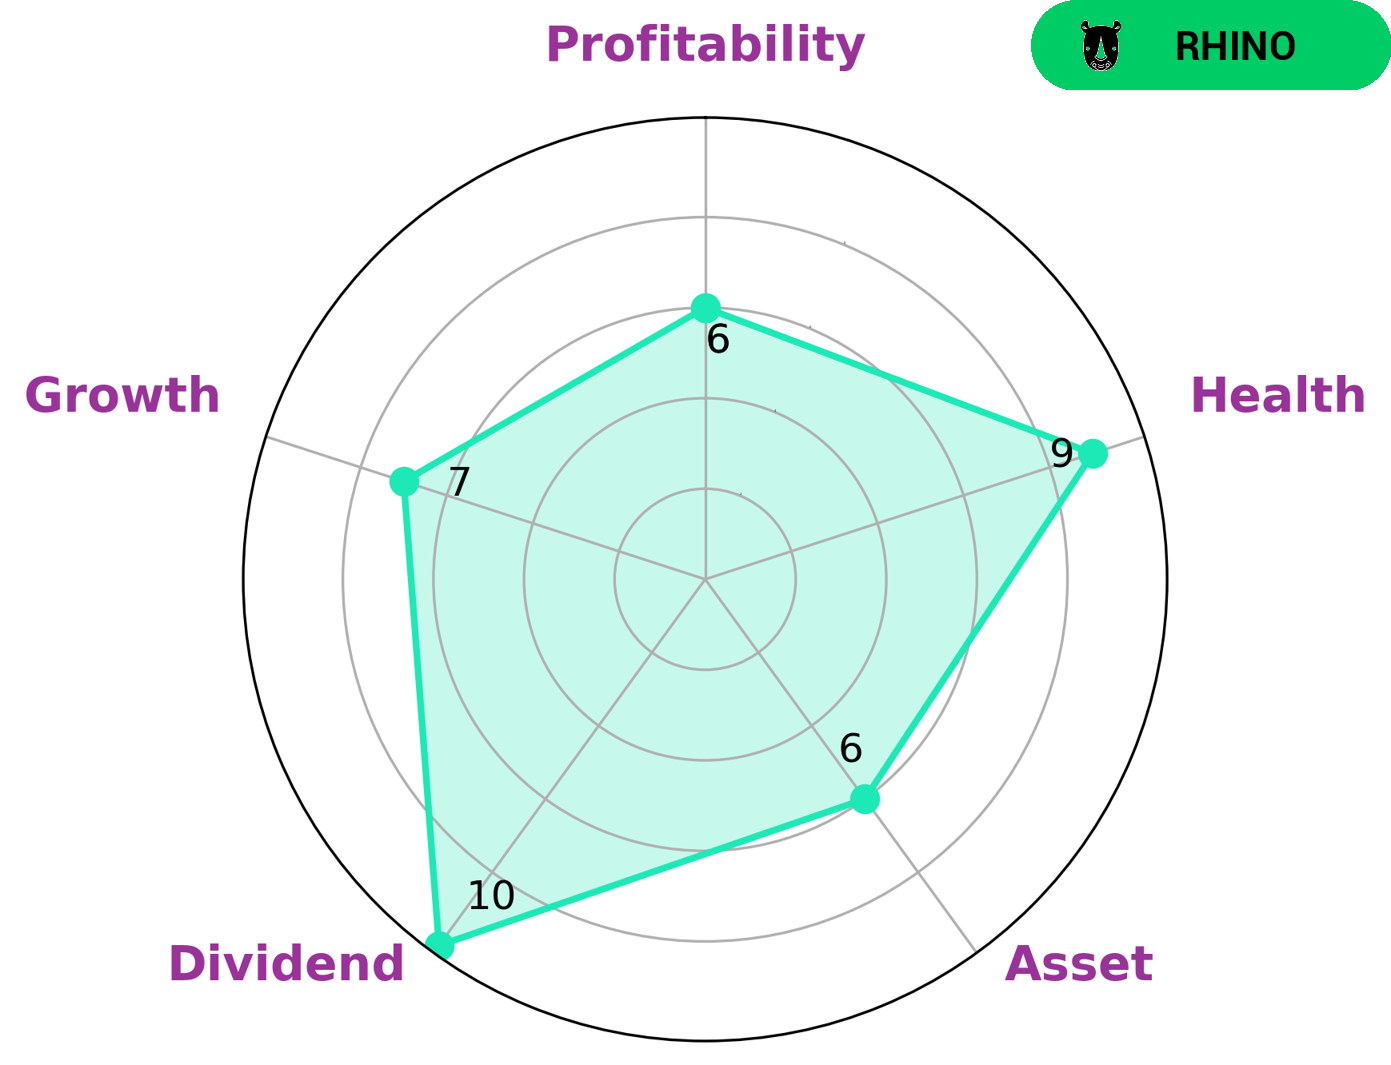
GoodWhale has conducted an analysis of WINNEBAGO INDUSTRIES‘ wellbeing and based on the Star Chart classification, we have concluded that WINNEBAGO INDUSTRIES is a ‘rhino’ which indicates moderate revenue or earnings growth. Investors who are looking for moderate growth may find WINNEBAGO INDUSTRIES an attractive option. As our analysis indicates, WINNEBAGO INDUSTRIES has a highly impressive health score of 9/10 due to its impressive cashflows and debt repayment capabilities. This is indicative of the company’s ability to pay off debt and fund future operations. Additionally, our analysis shows that WINNEBAGO INDUSTRIES has strong scores in dividend and growth, and a medium score in asset and profitability. More…
Peers
The competition between Winnebago Industries Inc and its competitors is fierce. Each company is striving to be the best in the industry and to provide the best products and services to their customers. This competition is good for the consumer because it allows them to choose from a variety of products and companies that are all trying to be the best. It also keeps the prices of the products and services down because the companies are always trying to outdo each other.
– Polaris Inc ($NYSE:PII)
Polaris Inc is a global company with a market cap of 5.58B as of 2022. It designs, engineers, and manufactures powersports vehicles, including motorcycles, snowmobiles, and ATVs. The company also manufactures related parts and accessories. Polaris has a strong focus on innovation and is constantly introducing new products to the market. The company’s return on equity is 32.56%.
– Hino Motors Ltd ($TSE:7205)
Hino Motors Ltd is a Japanese manufacturer of commercial vehicles and diesel engines. The company is a leading producer of medium and heavy-duty trucks in Japan, and is a part of the Toyota Group. Hino Motors Ltd has a market cap of 343.84B as of 2022, and a Return on Equity of -4.8%. The company manufactures a wide range of commercial vehicles, including trucks, buses, and engines. Hino Motors Ltd also has a strong presence in the global market, with exports to over 100 countries.
– Vaksons Automobiles Ltd ($BSE:539402)
Vaksons Automobiles Ltd is an Indian company that manufactures and sells automobiles. As of 2022, the company had a market capitalization of 215.14 million and a return on equity of -0.15%. The company’s products include cars, trucks, and buses.
Summary
Investor sentiment on WINNEBAGO INDUSTRIES took a hit after the company reported their FY2024 Q1 earnings results for the period ending November 30 2023. Total revenue for the quarter fell 19.9% year-over-year to USD 763.0 million and net income dropped 57.1% to USD 25.8 million. The stock price declined on the news.
Investors should consider potential risks before investing in WINNEBAGO INDUSTRIES, given the company’s declining financial performance in the near-term. It may be wise to wait for further developments before taking a position.
Related Posts


Recent Posts


