Vera Bradley Reports Earnings for FY2024 Q1 Ending June 7 2023
June 9, 2023

🌥️Earnings Overview
On June 7 2023, VERA BRADLEY ($NASDAQ:VRA) reported their financial results for the first quarter of fiscal year 2024. Total revenue for the quarter ended April 30 2023 was USD 94.4 million, a 4.2% decline from the same period in the prior year. Net income for the quarter amounted to USD -4.7 million, a decrease from the -7.0 million reported in the previous year.
Share Price
On Wednesday, VERA BRADLEY reported its earnings for the first quarter of the fiscal year 2024 ending June 7 2023. The stock opened the day at $6.0 and closed the day at the same price, soaring by 13.9% from its previous closing price of 5.2. The company’s earnings report revealed that despite the challenging market conditions, VERA BRADLEY had managed to increase their sales and overall growth. This was largely attributed to their successful marketing strategy and strong relationships with vendors and suppliers.
The strong results were seen as a positive indicator of the company’s continuing financial health, and investors responded positively to the news. As a result, the stock reached its highest price in over four years, and is likely to continue to be supported by positive investor sentiment in the future. Live Quote…
About the Company
Income Snapshot
Below shows the total revenue, net income and net margin for Vera Bradley. More…
| Total Revenues | Net Income | Net Margin |
| 495.86 | -57.44 | 0.0% |
Cash Flow Snapshot
Below shows the cash from operations, investing and financing for Vera Bradley. More…
| Operations | Investing | Financing |
| -11.09 | -17.31 | -10.19 |
Balance Sheet Snapshot
Below shows the total assets, liabilities and book value per share for Vera Bradley. More…
| Total Assets | Total Liabilities | Book Value Per Share |
| 379.93 | 132.94 | 8.05 |
Key Ratios Snapshot
Some of the financial key ratios for Vera Bradley are shown below. More…
| 3Y Rev Growth | 3Y Operating Profit Growth | Operating Margin |
| 1.6% | -0.2% | -18.8% |
| FCF Margin | ROE | ROA |
| -3.7% | -23.3% | -15.3% |
Analysis
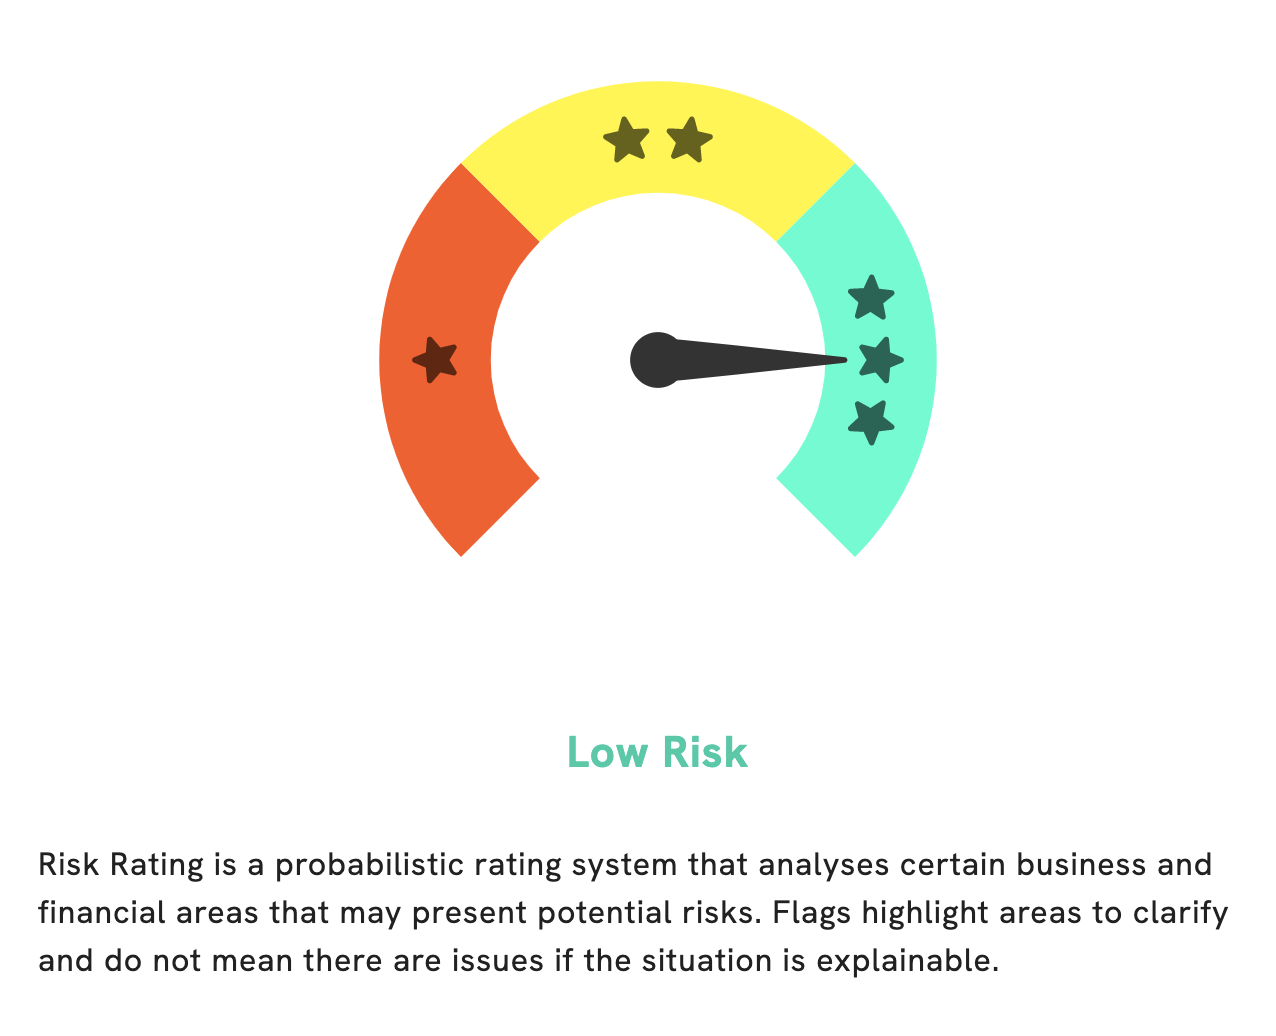
GoodWhale has conducted an analysis of VERA BRADLEY‘s wellbeing and found that it is at low risk according to our Risk Rating. This rating is based on various financial and business aspects. However, we have detected 1 risk warning in the company’s balance sheet. To view the details of this warning, become a registered user of GoodWhale and see what we have to offer. Our analysis can provide you with valuable insight to help you make informed decisions. More…
Peers
The competition between Vera Bradley Inc and its competitors, Puma SE, Deckers Outdoor Corp, and C Banner International Holdings Ltd, is fierce. All four companies are vying for a share of the global market in the fashion and accessories industry, offering unique products and designs that appeal to different consumer segments. Despite the intense competition, Vera Bradley Inc has managed to stand out and become one of the leading players in the industry.
– Puma SE ($LTS:0NQE)
Puma SE is a leading sports apparel and lifestyle brand that designs and manufactures products for professional athletes and everyday consumers. The company has a market cap of 8.14B as of 2022, reflecting the strong financial performance of the company. Puma SE also has an impressive Return on Equity (ROE) of 17.11%, demonstrating the company’s ability to generate profit from its investments. This indicates that the company is making effective use of its resources, and has strong prospects for future growth. With its strong financial performance, Puma SE is well-positioned to continue its success in the global market.
– Deckers Outdoor Corp ($NYSE:DECK)
Deckers Outdoor Corp is a global leader in designing and marketing lifestyle footwear, apparel, and accessories. Founded in 1973, Deckers Outdoor is headquartered in Goleta, California and has achieved a market cap of 10.35 billion as of 2022. Additionally, the company has a Return on Equity of 23.76% which reflects the company’s financial health and ability to generate profits from its shareholders’ investments. Deckers Outdoor Corp has become a leading designer and marketer of lifestyle footwear, apparel, and accessories for both men and women. The company has established a strong presence in the U.S. and International markets and is poised for continued growth.
– C Banner International Holdings Ltd ($SEHK:01028)
Banner International Holdings Ltd is a Hong Kong-based investment holding company that operates in the property and hotel industry. The company’s market cap of 386.32M as of 2022 reflects the impressive financial performance and growth potential it has demonstrated in recent years. Banner International Holdings Ltd has also demonstrated strong Return on Equity (ROE) of 0.93%, indicating that the company is using its assets and equity efficiently to generate profits and returns for its shareholders.
Summary
Investors may be viewing the recent quarterly earnings report from VERA BRADLEY cautiously. Despite a 4.2% decrease in total revenue year-over-year, the company’s stock price moved up on the same day of the report. While the net income of -4.7 million was better than the -7 million reported for the previous year, VERA BRADLEY continues to operate at a loss and may be a risky investment. Investors should consider their own financial goals and risk appetite before deciding to invest in VERA BRADLEY.
Related Posts


Recent Posts


