UNIFI Reports Fiscal Year 2023 Q4 Earnings Results on August 23
September 6, 2023

🌥️Earnings Overview
On August 23, 2023, UNIFI ($NYSE:UFI) reported its earnings results for the fourth quarter of fiscal year 2023, ending on June 30, 2023. The company reported total revenue of USD 151.1 million, a 30.6% decrease from the same period last year. Net income for this quarter decreased from 3.5 million the prior year to USD -15.3 million.
Price History
The stock opened at $7.3 and, despite some positive news from the announcement, closed at $7.2, down 1.0% from its prior closing price of $7.3. The company also announced plans to invest heavily in research and development in an effort to expand their technology capabilities. These investments should position UNIFI for continued growth in the future.
In response to the news, investors remained bullish on UNIFI’s future prospects and continued to express confidence in the company as they bid up its share price during the day. While shares retreated by 1.0%, the company is still optimistic that its latest investments and technological advancements will drive share prices higher in the coming quarters. Live Quote…
About the Company
Income Snapshot
Below shows the total revenue, net income and net margin for Unifi. UNIFI_Reports_Fiscal_Year_2023_Q4_Earnings_Results_on_August_23″>More…
| Total Revenues | Net Income | Net Margin |
| 623.53 | -46.34 | -6.7% |
Cash Flow Snapshot
Below shows the cash from operations, investing and financing for Unifi. UNIFI_Reports_Fiscal_Year_2023_Q4_Earnings_Results_on_August_23″>More…
| Operations | Investing | Financing |
| 4.74 | -36.23 | 25.94 |
Balance Sheet Snapshot
Below shows the total assets, liabilities and book value per share for Unifi. UNIFI_Reports_Fiscal_Year_2023_Q4_Earnings_Results_on_August_23″>More…
| Total Assets | Total Liabilities | Book Value Per Share |
| 538.82 | 215.21 | 17.9 |
Key Ratios Snapshot
Some of the financial key ratios for Unifi are shown below. UNIFI_Reports_Fiscal_Year_2023_Q4_Earnings_Results_on_August_23″>More…
| 3Y Rev Growth | 3Y Operating Profit Growth | Operating Margin |
| 0.9% | 36.4% | -6.1% |
| FCF Margin | ROE | ROA |
| -5.1% | -7.2% | -4.4% |
Analysis
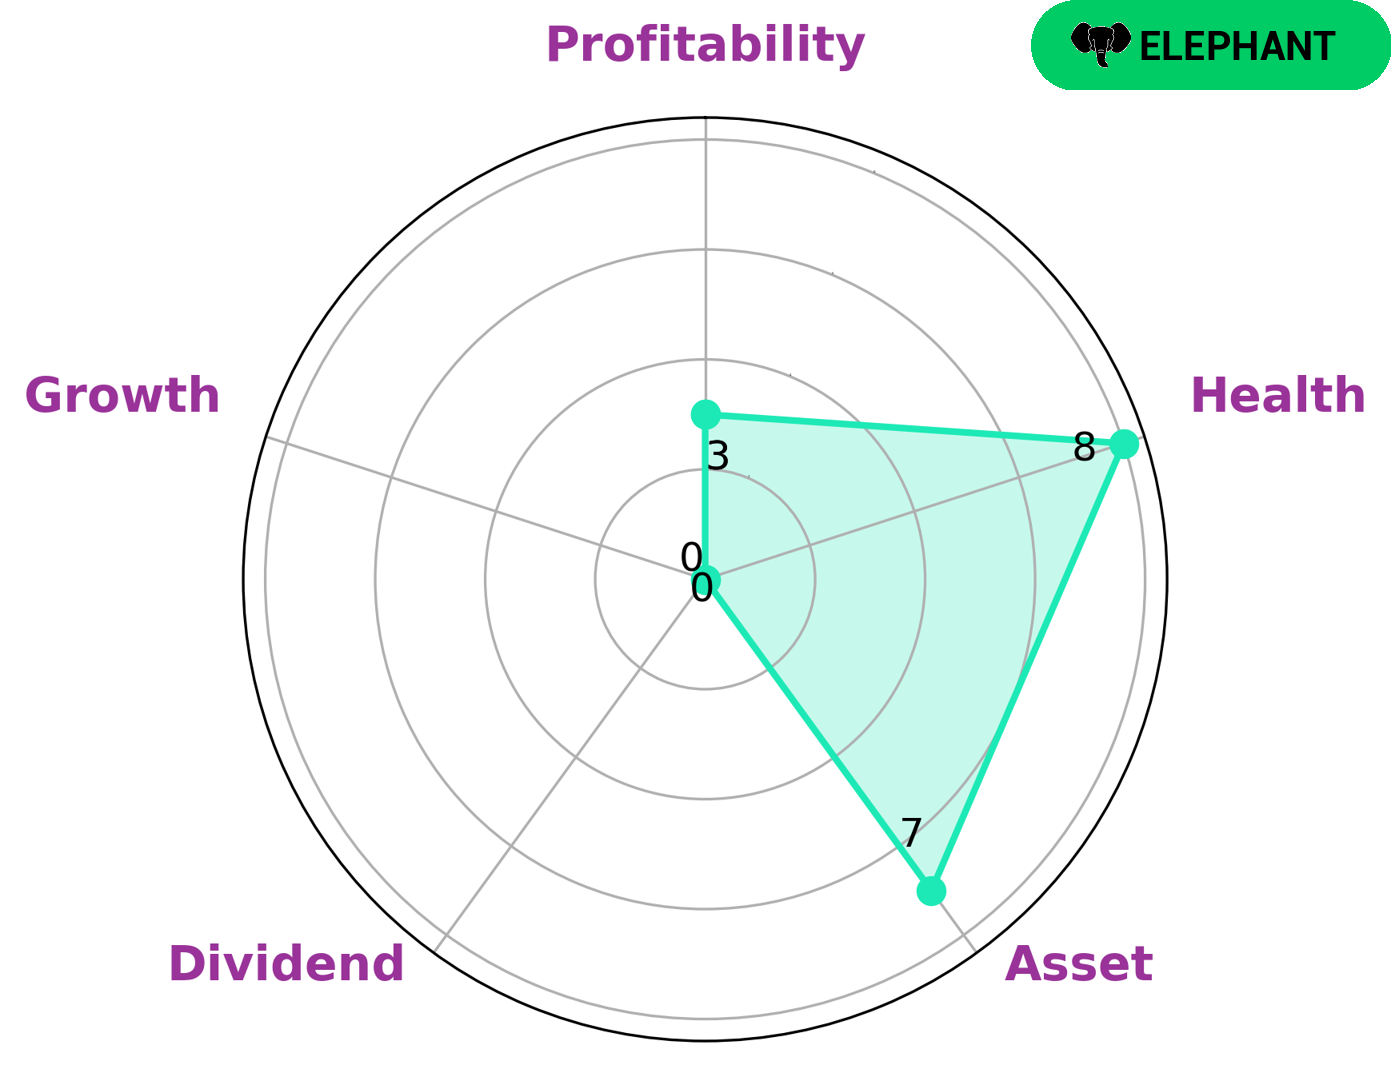
GoodWhale has conducted an analysis of UNIFI‘s wellbeing and the results are very encouraging. The Star Chart indicates that UNIFI has a high health score of 8/10, meaning that it has strong cash flows and is capable of riding out any crisis without the risk of bankruptcy. Further analysis reveals that UNIFI is strong in assets and weak in dividend, growth, and profitability. This led us to classify UNIFI as an ‘elephant’, which is a company with a high amount of assets after liabilities have been deducted. This type of company may be attractive to income investors who seek a steady stream of dividend returns, as well as value investors who are looking for companies with strong assets that could appreciate in value over time. Furthermore, investors who are confident in the ability of UNIFI’s management team to turn around sluggish performance in terms of growth and profitability may also have an interest in this company’s stock. More…
Peers
The company has a diversified product portfolio and a wide range of customers. Unifi‘s competitors include Valson Industries Ltd, Pioneer Embroideries Ltd, and Hsin Sin Textile Co Ltd.
– Valson Industries Ltd ($BSE:530459)
Valson Industries Ltd is a publicly traded company with a market capitalization of 189.22M as of 2022. The company has a return on equity of 2.05%. Valson Industries Ltd is engaged in the manufacture and sale of textile products. The company’s products include fabrics, garments, and home furnishings.
– Pioneer Embroideries Ltd ($BSE:514300)
Pioneer Embroideries Ltd is a publicly traded company with a market capitalization of 1.15 billion as of 2022. The company has a return on equity of 7.28%. Pioneer Embroideries Ltd is engaged in the business of manufacturing and marketing embroidery products. The company’s products are sold under the brand names of Pioneer, Janome, and Husqvarna.
– Hsin Sin Textile Co Ltd ($TPEX:4406)
Hsin Sin Textile Co Ltd is a textile company that produces a wide range of textile products, including fabrics, yarns, garments, and home textiles. The company has a market cap of 547.67M as of 2022 and a return on equity of 2.47%. Hsin Sin Textile Co Ltd is a publicly traded company listed on the Taiwan Stock Exchange.
Summary
UNIFI reported its FY2023 Q4 earnings results on August 23, with total revenue of USD 151.1 million, a decrease of 30.6% compared to the same period last year. Net income was USD -15.3 million, compared to the prior year of 3.5 million. Investors should note that UNIFI is trending downwards in terms of both revenue and net income results, and that the company may not be a reliable long-term investment. For those interested in short-term investments, it may be wise to watch the stock performance closely and seek other potential options.
Related Posts


Recent Posts


