Toll Brothers Reports Third Quarter Earnings for Fiscal Year 2023
August 29, 2023

🌥️Earnings Overview
On July 31, 2023, TOLL BROTHERS ($NYSE:TOL) announced their third-quarter fiscal year 2023 earnings results, revealing a 7.7% year-on-year increase in total revenue to USD 2687.6 million and a staggering 51.7% jump in net income to USD 414.8 million compared to the same period of 2023.
Price History
On Tuesday, TOLL BROTHERS reported their third quarter earnings for fiscal year 2023. The stock opened at $75.4 and closed at $75.9, up by 1.2% from its prior closing price of 75.0. This marks the third consecutive quarter of positive earnings growth for the company, signaling an overall positive outlook for the company’s future performance. The strong performance in the third quarter was driven by improved sales of luxury homes and increased demand for high-end properties in many markets.
This was supported by a strong construction pipeline, coupled with a favorable interest rate environment and attractive financing options. This provides Toll Brothers with added flexibility to invest in new projects and capitalize on the strong housing market conditions going forward. Overall, these results demonstrate that Toll Brothers is continuing to make great strides in the housing market and should be well-positioned to capitalize on further growth opportunities going forward. Live Quote…
About the Company
Income Snapshot
Below shows the total revenue, net income and net margin for Toll Brothers. More…
| Total Revenues | Net Income | Net Margin |
| 10.69k | 1.57k | 13.7% |
Cash Flow Snapshot
Below shows the cash from operations, investing and financing for Toll Brothers. More…
| Operations | Investing | Financing |
| 1.34k | -153.18 | -1.12k |
Balance Sheet Snapshot
Below shows the total assets, liabilities and book value per share for Toll Brothers. More…
| Total Assets | Total Liabilities | Book Value Per Share |
| 12.35k | 5.64k | 61.22 |
Key Ratios Snapshot
Some of the financial key ratios for Toll Brothers are shown below. More…
| 3Y Rev Growth | 3Y Operating Profit Growth | Operating Margin |
| 15.6% | 53.4% | 19.2% |
| FCF Margin | ROE | ROA |
| 11.8% | 19.6% | 10.4% |
Analysis
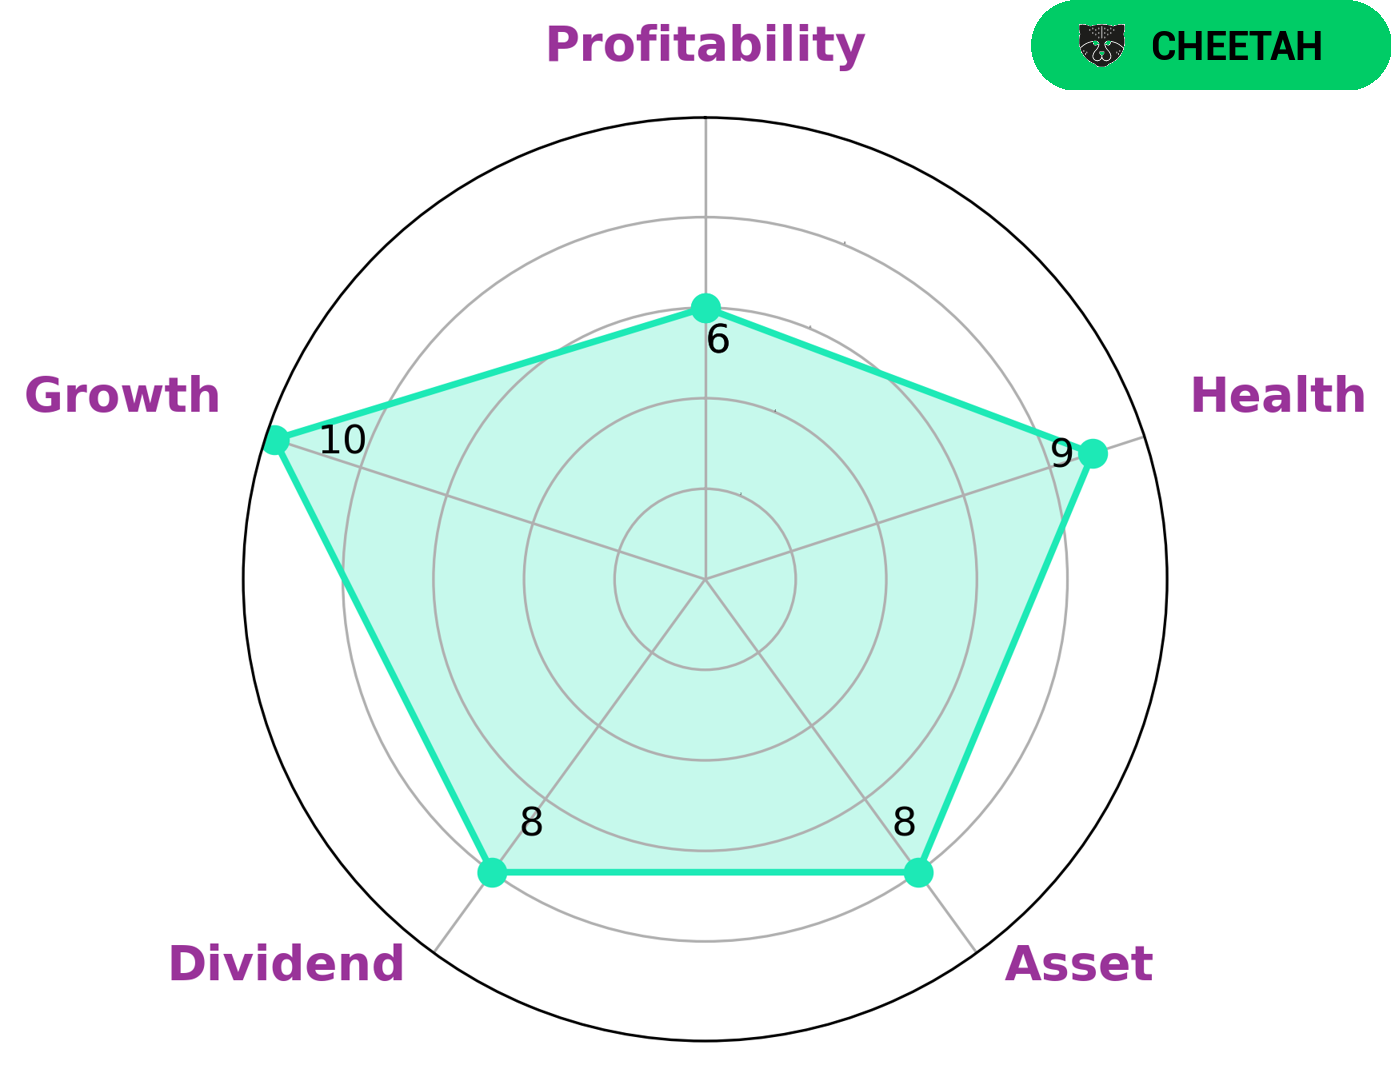
At GoodWhale, we have conducted an analysis of the fundamentals of TOLL BROTHERS. According to our Star Chart, TOLL BROTHERS has an impressive health score of 9/10 when it comes to cashflows and debt. This indicates that the company is financially secure and able to pay off its debt and fund future operations. When it comes to TOLL BROTHERS, we classify them as a ‘cheetah’ company, meaning they have achieved significant revenue or earnings growth but have lower profitability. This type of company may be attractive to investors looking for rapid growth at the cost of some instability, as typically associated with higher risk investments. Finally, we rate TOLL BROTHERS as strong in assets, dividends, and growth, and medium in profitability. This may present an interesting opportunity for investors who are willing to take on some risk in exchange for potentially high returns. More…
Peers
The company is headquartered in Horsham, Pennsylvania, and operates in 22 states. The company’s product offerings include single-family detached homes, attached homes, and condominiums. The company’s competitors include D.R. Horton Inc, Redbubble Ltd, and PulteGroup Inc.
– D.R. Horton Inc ($NYSE:DHI)
D.R. Horton Inc is a homebuilding company that was founded in 1978 and is headquartered in Fort Worth, Texas. As of 2022, the company had a market capitalization of 28.86 billion and a return on equity of 25.26%. The company operates in 26 states and 84 markets across the United States. D.R. Horton is the largest homebuilder in the United States by volume, with a market share of approximately 18%. The company builds single-family detached homes, townhomes, and condominiums.
– Redbubble Ltd ($ASX:RBL)
Redbubble Ltd has a market cap of 168.95M as of 2022 and a Return on Equity of -12.32%. The company is an online marketplace that allows artists to sell their artwork on a variety of products.
– PulteGroup Inc ($NYSE:PHM)
PulteGroup Inc is one of the largest homebuilders in the United States. The company has a market cap of 9.97 billion as of 2022 and a return on equity of 24.61%. The company builds and sells single-family homes, townhouses, condominiums, and apartments in the United States.
Summary
Toll Brothers is continuing its upward trajectory, with total revenue for the third quarter of fiscal year 2023 coming in at USD 2687.6 million, a 7.7% increase from the same period the previous year. Net income increased by 51.7%, to USD 414.8 million, compared to August 22 of 2023. This strong financial position, combined with a consistent track record of revenue growth, make it an attractive option for investors.
The company’s ongoing commitment to innovation and quality also makes it a desirable investment opportunity. Therefore, investors should consider Toll Brothers when deciding on a portfolio strategy.
Related Posts


Recent Posts


