TFPM Intrinsic Value Calculation – TRIPLE FLAG PRECIOUS METALS Reports 46.4% Increase in FY2023 Q3 Earnings
November 27, 2023

☀️Earnings Overview
On November 7 2023, TRIPLE FLAG PRECIOUS METALS ($NYSE:TFPM) reported their FY2023 Q3 earnings, showing an increase of 46.4% from the same period in the prior year. Total revenue was USD 49.4 million, while net income decreased from 12.8 million to -6.0 million in the same quarter.
Analysis – TFPM Intrinsic Value Calculation
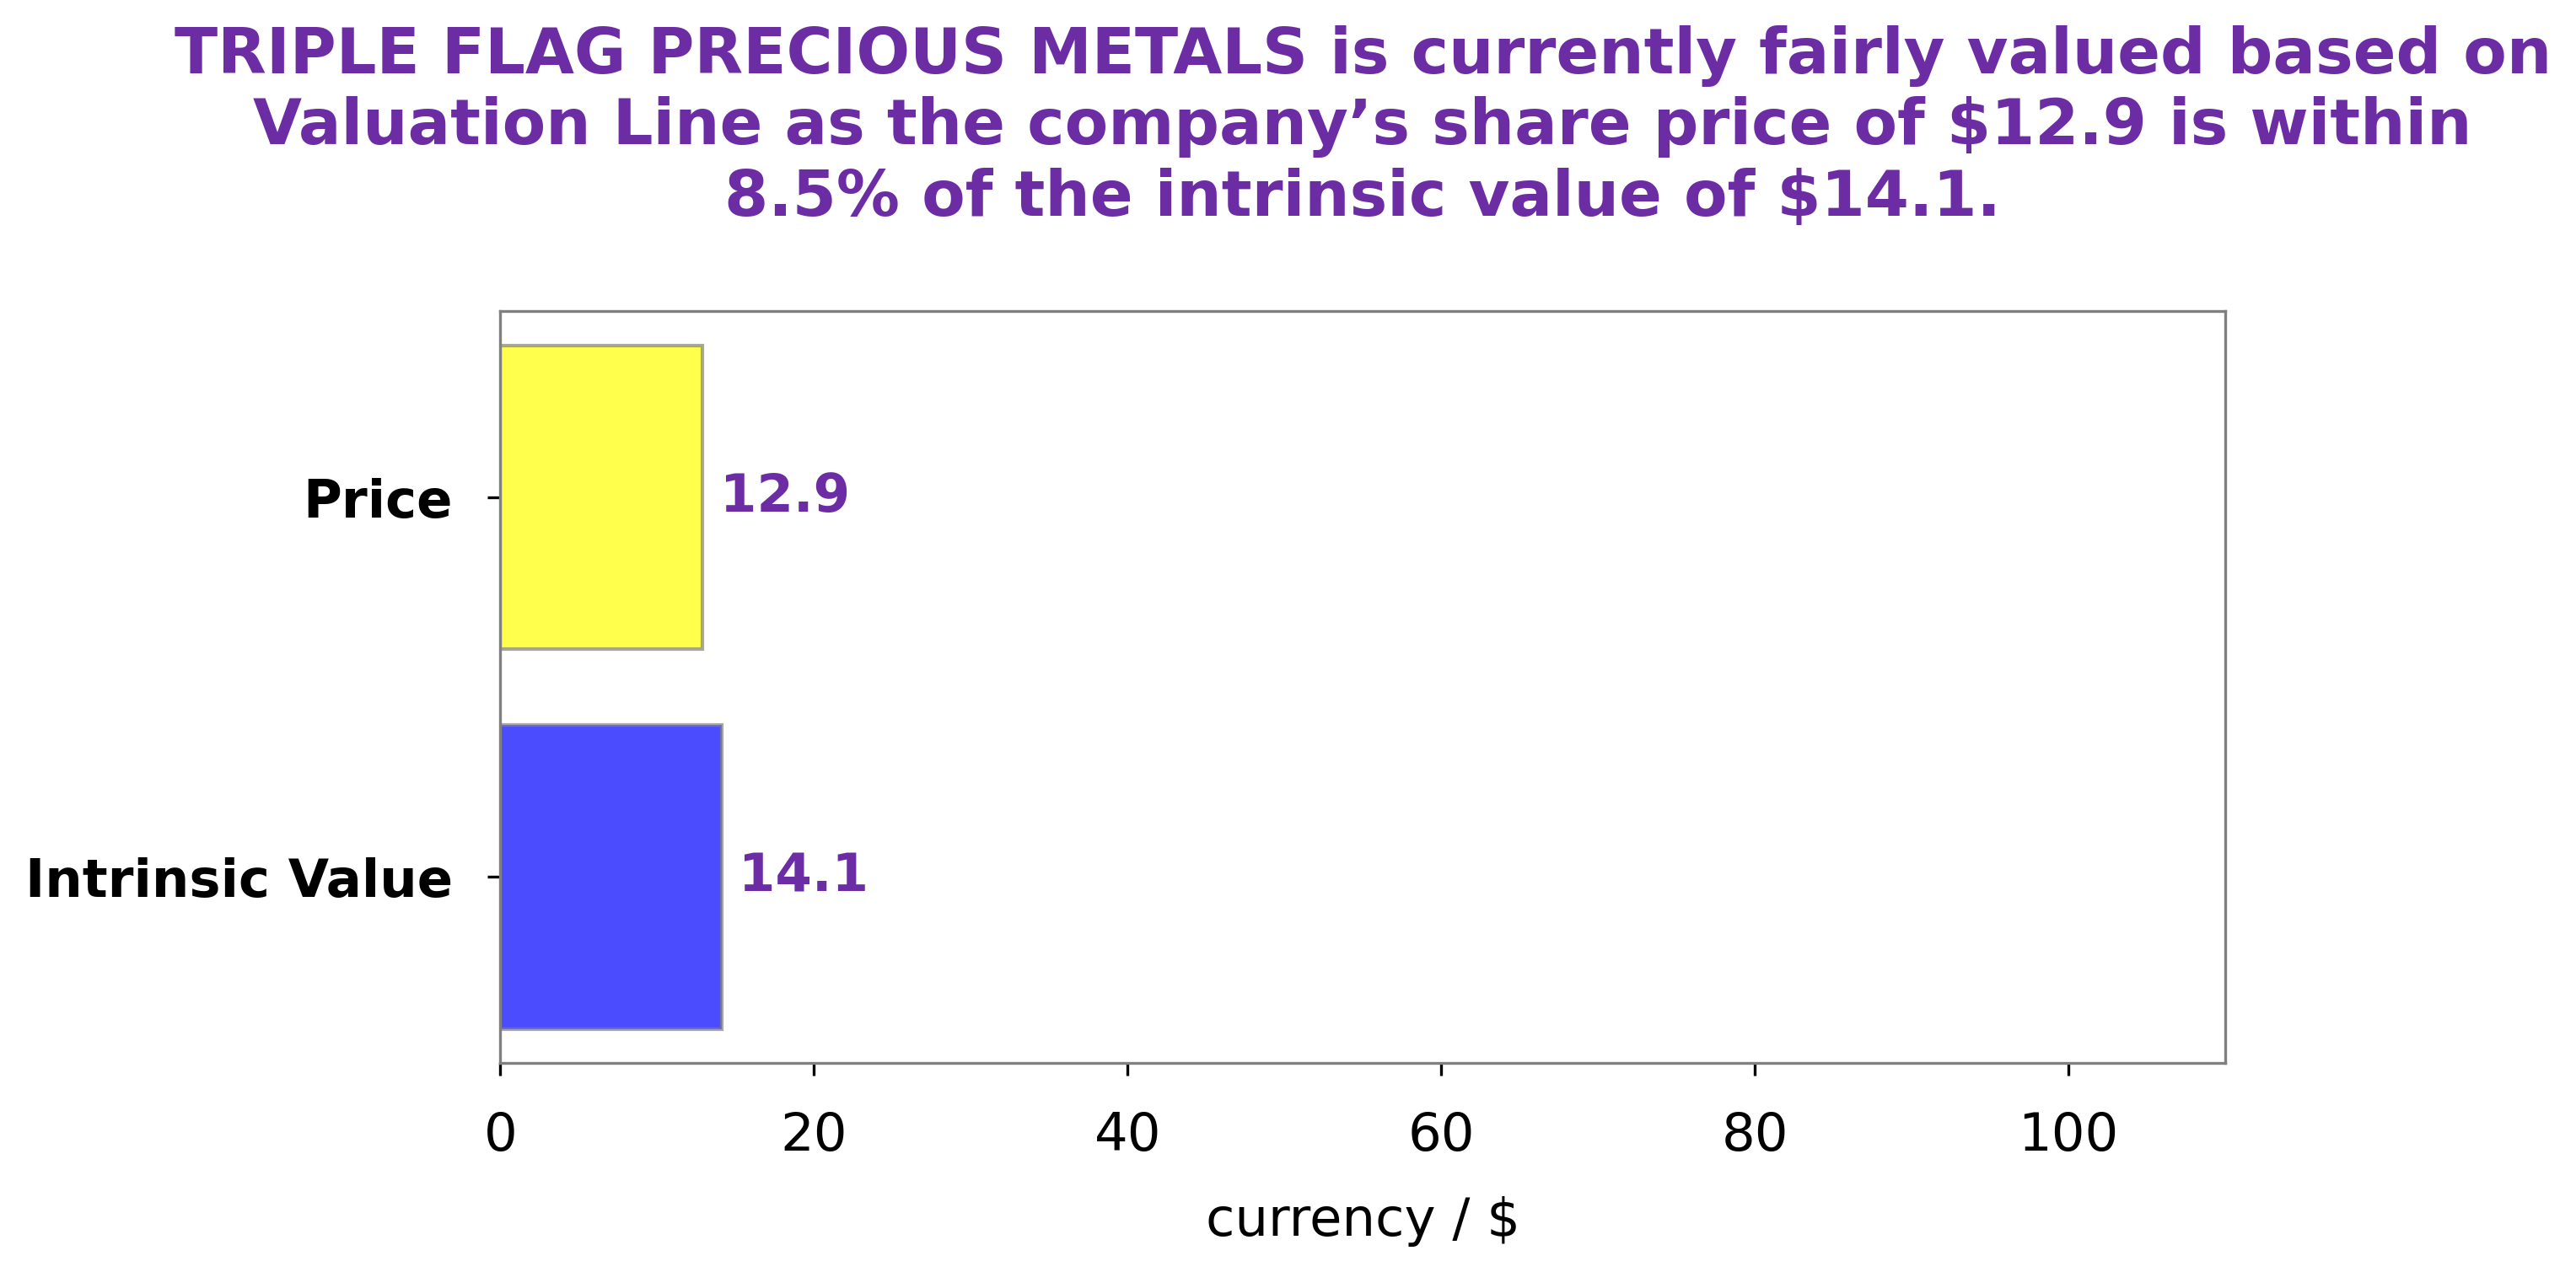
GoodWhale’s analysis of TRIPLE FLAG PRECIOUS METALS’ fundamentals has revealed an intrinsic value of $14.1 for the company’s share. This figure was computed through GoodWhale’s proprietary Valuation Line, which uses various financial indicators to calculate the true value of a company’s stock. Currently, TRIPLE FLAG PRECIOUS METALS’ stock is traded at a price of $12.9, which is 8.2% lower than its intrinsic value. This presents an attractive opportunity for investors looking for a company that is currently undervalued. More…
About the Company
Income Snapshot
Below shows the total revenue, net income and net margin for TFPM. More…
| Total Revenues | Net Income | Net Margin |
| 196.17 | 41.99 | 30.6% |
Cash Flow Snapshot
Below shows the cash from operations, investing and financing for TFPM. More…
| Operations | Investing | Financing |
| 153.22 | -241.25 | 19.68 |
Balance Sheet Snapshot
Below shows the total assets, liabilities and book value per share for TFPM. More…
| Total Assets | Total Liabilities | Book Value Per Share |
| 1.91k | 84.08 | 6.54 |
Key Ratios Snapshot
Some of the financial key ratios for TFPM are shown below. More…
| 3Y Rev Growth | 3Y Operating Profit Growth | Operating Margin |
| 36.9% | 301.9% | 23.6% |
| FCF Margin | ROE | ROA |
| 51.5% | 2.2% | 1.5% |
Summary
Investors of TRIPLE FLAG PRECIOUS METALS should be aware of the company’s latest earnings results reported on November 7 2023. The quarterly revenue of USD 49.4 million and the reported net income of USD -6.0 million were noteworthy, as the revenue had increased by 46.4% year-over-year while the net income had decreased by 12.8 million from the previous year. The market’s reaction to these results will be key for investors to assess the company’s progress and potential future performance.


