SYNOPSYS Reports Third Quarter Earnings for FY2023 on July 31st
August 23, 2023

🌥️Earnings Overview
On July 31st 2023, SYNOPSYS ($NASDAQ:SNPS) reported net income of USD 336.2 million for the third quarter of FY2023, representing a year-on-year increase of 51.0% over the same period in the previous year. The company also achieved total revenue of USD 1487.3 million, showing a 19.2% growth from the same quarter the year before.
Share Price
On Wednesday, July 31st, SYNOPSYS reported its third-quarter earnings for the fiscal year 2023. SYNOPSYS stock opened at $436.6, but closed at $428.2, a decrease of 2.0% from the prior closing price of 436.7. The company’s financial results were driven largely by its strong growth in the software and IP segment, which saw revenue growth of 16% year-over-year.
Overall, SYNOPSYS reported strong financial performance in its third quarter of FY2023, driven by its software and IP segment and semiconductor segment. Looking ahead, the company remains optimistic that it will continue to deliver strong earnings in the coming quarters. Live Quote…
About the Company
Income Snapshot
Below shows the total revenue, net income and net margin for Synopsys. More…
| Total Revenues | Net Income | Net Margin |
| 5.53k | 1.03k | 20.0% |
Cash Flow Snapshot
Below shows the cash from operations, investing and financing for Synopsys. More…
| Operations | Investing | Financing |
| 1.77k | -222.85 | -1.23k |
Balance Sheet Snapshot
Below shows the total assets, liabilities and book value per share for Synopsys. More…
| Total Assets | Total Liabilities | Book Value Per Share |
| 9.92k | 3.92k | 39.17 |
Key Ratios Snapshot
Some of the financial key ratios for Synopsys are shown below. More…
| 3Y Rev Growth | 3Y Operating Profit Growth | Operating Margin |
| 16.3% | 23.4% | 20.4% |
| FCF Margin | ROE | ROA |
| 28.9% | 12.0% | 7.1% |
Analysis
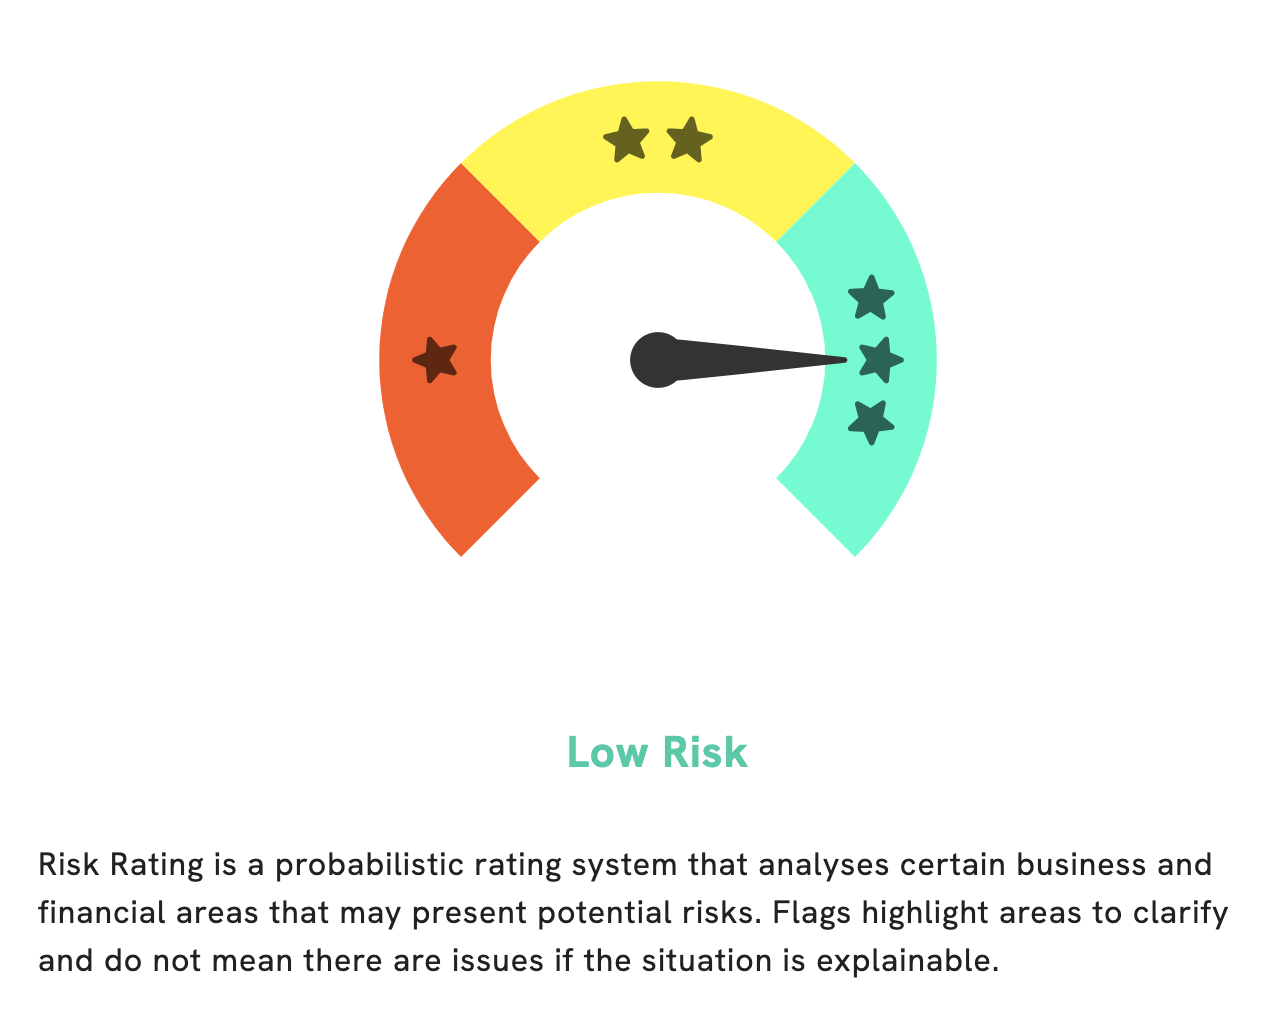
At GoodWhale, we conducted an analysis of SYNOPSYS‘s wellbeing. The results showed that the company is a low risk investment when it comes to financial and business aspects. If you are interested in finding out more about the business and financial areas with potential risks, you can become a registered user on our website. This gives you access to detailed information about the areas where SYNOPSYS could be vulnerable, so you can make an informed decision when it comes to investing. More…
Peers
Its main competitors are Cadence Design Systems Inc, Goodpatch Inc, and Zuken Elmic Inc.
– Cadence Design Systems Inc ($NASDAQ:CDNS)
Cadence Design Systems is a software company that provides tools that help engineers design semiconductors and other electronic products. The company’s market cap is $43.36 billion, and its return on equity is 22.8%. Cadence’s products are used by engineers to design and verify the manufacturing of semiconductors, computer chips, and other electronic products.
– Goodpatch Inc ($TSE:7351)
Patch Inc is a technology company that provides software development and IT services. The company has a market cap of 5.5 billion as of 2022 and a return on equity of 8.49%. Patch Inc offers a wide range of services including web and mobile application development, cloud computing, big data, and artificial intelligence. The company has a strong focus on helping its clients grow their businesses and expand their reach. Patch Inc has a team of experienced and skilled professionals who are dedicated to providing the best possible services to their clients.
– Zuken Elmic Inc ($TSE:4770)
Zuken Elmic Inc. is a Japanese electronics company that specializes in electronic design automation (EDA) software. The company has a market capitalization of 2 billion as of 2022 and a return on equity of 13.95%. The company’s products are used by electronics manufacturers to design and test printed circuit boards (PCBs). Zuken Elmic’s products are used by some of the world’s largest electronics companies, such as Samsung, LG, and Sony.
Summary
Investors are bullish on Synopsys, as the company’s Q3 FY2023 financial performance continues to impress. Total revenue rose 19.2% year-on-year to USD 1487.3 million, marking a new record. Net income also grew by 51.0% to USD 336.2 million.
This is the sixth consecutive quarter of positive earnings growth and indicates that Synopsys is well-positioned for continued success in the coming quarters. The long-term outlook for the company looks bright, with its strong financials indicating that it will remain an attractive investment option.
Related Posts


Recent Posts


