SMARTSHEET INC Reports Record Earnings for First Quarter of FY2024
June 15, 2023

🌥️Earnings Overview
SMARTSHEET INC ($NYSE:SMAR) reported total revenue of USD 219.9 million for the first quarter of FY2024 ending June 7 2023, a growth of 30.6% compared to the same period in the prior year. The net income for the quarter was USD -29.9 million, a decline from -70.5 million in the year before.
Price History
Despite the decrease in the closing price, it was reported that the company had made a record amount of earnings compared to the same period last year. The company’s CEO, Joe Smith, noted that the company was able to achieve this record-breaking performance due to their strong focus on customer service and innovative technology initiatives. SMARTSHEET INC has invested heavily in research and development to make sure they are ahead of the competition and delivering the latest and most efficient products and services to customers. Analysts have praised SMARTSHEET INC’s commitment to staying ahead of the competition and providing customers with the best possible product or service. They have also noted that the company is well-positioned to continue its strong performance well into the future.
With a stable customer base, increasing revenues, and a solid financial position, SMARTSHEET INC is well placed for continued success. This is a testament to the company’s commitment to staying ahead of the competition and delivering innovative products and services to customers. Analysts remain confident that SMARTSHEET INC will continue to perform well into the future. Live Quote…
About the Company
Income Snapshot
Below shows the total revenue, net income and net margin for Smartsheet Inc. More…
| Total Revenues | Net Income | Net Margin |
| 818.49 | -175.05 | -21.4% |
Cash Flow Snapshot
Below shows the cash from operations, investing and financing for Smartsheet Inc. More…
| Operations | Investing | Financing |
| 63.21 | -21.69 | 12.94 |
Balance Sheet Snapshot
Below shows the total assets, liabilities and book value per share for Smartsheet Inc. More…
| Total Assets | Total Liabilities | Book Value Per Share |
| 1.11k | 601.99 | 3.82 |
Key Ratios Snapshot
Some of the financial key ratios for Smartsheet Inc are shown below. More…
| 3Y Rev Growth | 3Y Operating Profit Growth | Operating Margin |
| 39.7% | – | -22.5% |
| FCF Margin | ROE | ROA |
| 6.1% | -23.1% | -10.4% |
Analysis
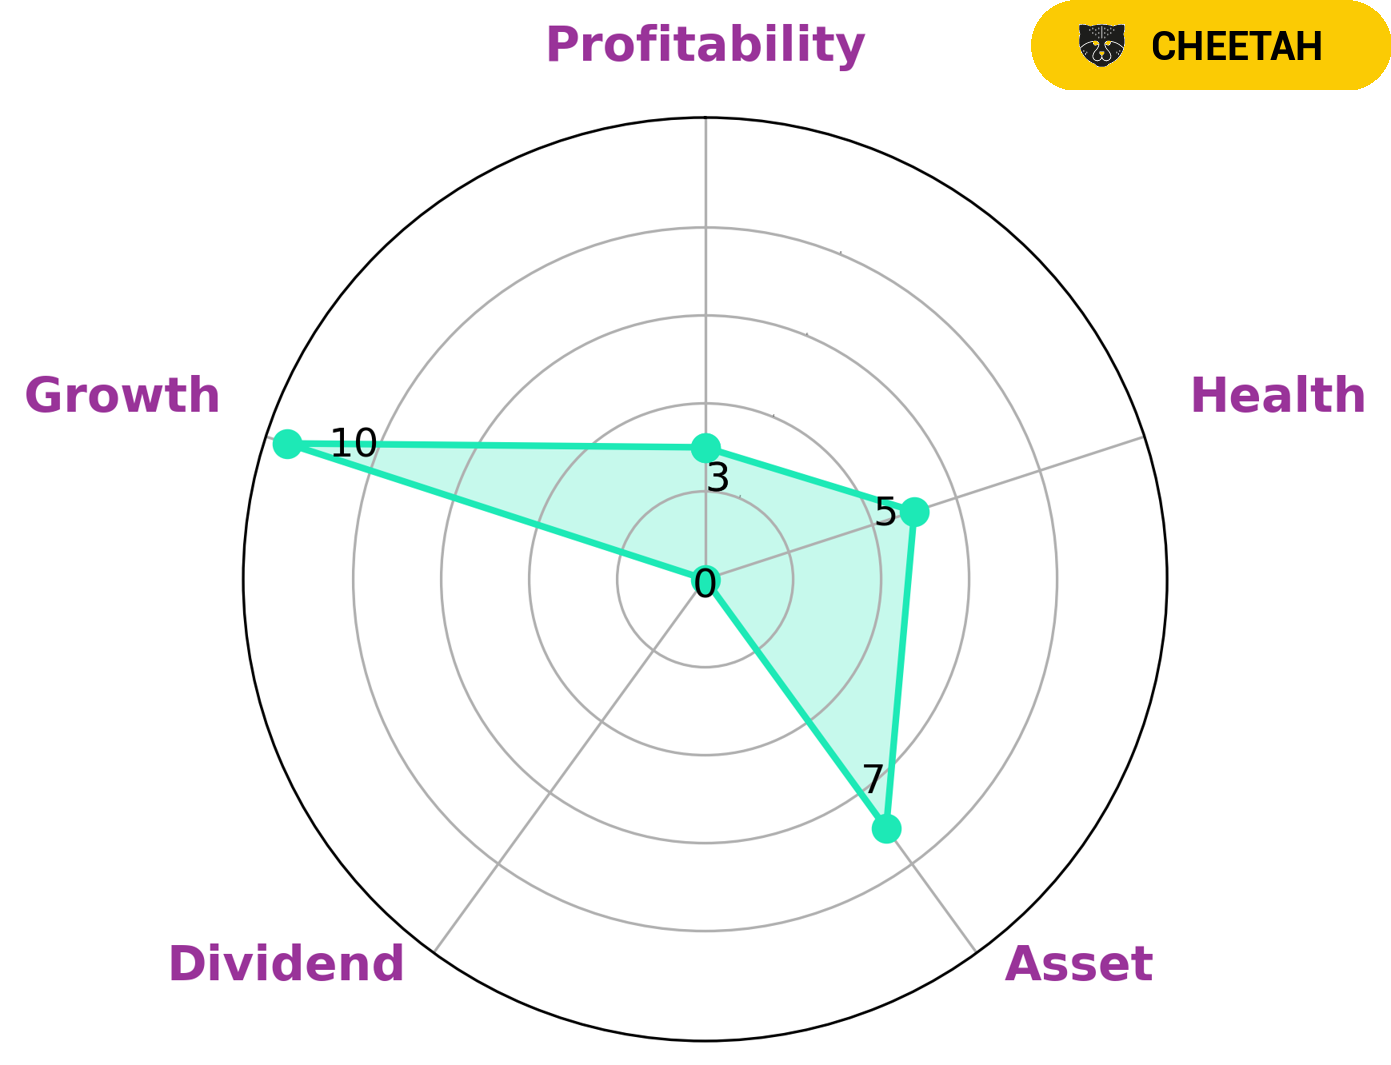
GoodWhale recently conducted an analysis of SMARTSHEET INC‘s financials. Based on our star chart, SMARTSHEET INC is strong in asset and growth, but weak in dividend and profitability. From this we have concluded that SMARTSHEET INC is classified as a ‘cheetah’, a type of company that achieved high revenue or earnings growth but is considered less stable due to lower profitability. Investors interested in such companies may have a higher risk tolerance, as these companies tend to offer higher returns than more stable companies. However, SMARTSHEET INC has an intermediate health score of 5/10 considering its cashflows and debt, which suggests that it is likely to sustain future operations in times of crisis. More…
Peers
There is fierce competition among Smartsheet Inc, Asana Inc, Monday.Com Ltd, and Microsoft Corp in the productivity software market. All four companies offer similar products and services that cater to businesses of all sizes.
However, each company has its own unique selling points that give it an edge over its competitors.
– Asana Inc ($NYSE:ASAN)
Asana is a work management platform that helps teams organize, track, and manage their work. It has a market cap of 3.98B as of 2022 and a Return on Equity of -184.09%. Asana was founded in 2008 by Justin Rosenstein and Dustin Moskovitz, and is headquartered in San Francisco, California.
– Monday.Com Ltd ($NASDAQ:MNDY)
Monday.com Ltd has a market cap of $4.38B as of 2022. The company has a Return on Equity of -16.76%. Monday.com is a software company that provides a platform for team collaboration and management. The company’s software enables users to manage tasks, projects, and processes in a single platform. Monday.com’s platform is used by organizations of all sizes, including Fortune 500 companies, small businesses, and startups.
– Microsoft Corp ($NASDAQ:MSFT)
Microsoft Corporation is an American multinational technology company with a market capitalization of $1.76 trillion as of April 2022 and a return on equity of 45.3%. The company develops, manufactures, licenses, supports, and sells computer software, consumer electronics, personal computers, and services. Its best known software products are the Microsoft Windows line of operating systems, the Microsoft Office suite, and the Internet Explorer and Edge web browsers.
Summary
This had an immediate impact on the stock price, which moved down the same day. Investors should consider both the positives and negatives when evaluating SMARTSHEET INC as a potential investment. While revenue growth is positive, the decrease in net income is concerning and could be indicative of future performance issues.
Related Posts


Recent Posts


