Smartrent Stock Fair Value Calculation – SMARTRENT Reports Record Earnings for Q2 2023
August 14, 2023

🌥️Earnings Overview
On August 8, 2023, SMARTRENT ($NYSE:SMRT) released its earnings results for the second quarter of fiscal year 2023, revealing total revenue of USD 53.4 million – an impressive 25.9% increase from the same period in the previous year. Moreover, net income for the quarter was -10.4 million, compared to a net loss of -25.6 million in the same quarter of the prior year.
Price History
On Tuesday, SMARTRENT, a leading provider of advanced rental software solutions, released their financial results for the second quarter of 2023. The results showed record earnings for the company, with SMARTRENT stock opening at $3.7 and closing at $3.6, down by 4.7% from the previous closing price of $3.8. The strong performance was attributed to the increased adoption of its rental management software by customers, which enabled the company to capture more revenue from their rentals.
Additionally, the company has invested heavily in research and development to ensure its products remain at the cutting edge of technology, allowing it to cater to an ever-evolving market. The company also announced that it had secured new contracts with several major clients during the quarter, which will help bolster its future growth prospects. Overall, the record earnings for SMARTRENT reported for Q2 2023 demonstrate its underlying strength as a business and its ability to continue delivering value to its customers. With increasing demand for rental software solutions, the company looks set to continue its growth trajectory in the coming quarters. Live Quote…
About the Company
Income Snapshot
Below shows the total revenue, net income and net margin for Smartrent. SMARTRENT_Reports_Record_Earnings_for_Q2_2023″>More…
| Total Revenues | Net Income | Net Margin |
| 206.53 | -70.9 | -34.3% |
Cash Flow Snapshot
Below shows the cash from operations, investing and financing for Smartrent. SMARTRENT_Reports_Record_Earnings_for_Q2_2023″>More…
| Operations | Investing | Financing |
| -61.87 | -1.86 | -2.17 |
Balance Sheet Snapshot
Below shows the total assets, liabilities and book value per share for Smartrent. SMARTRENT_Reports_Record_Earnings_for_Q2_2023″>More…
| Total Assets | Total Liabilities | Book Value Per Share |
| 521.48 | 174.28 | 1.74 |
Key Ratios Snapshot
Some of the financial key ratios for Smartrent are shown below. SMARTRENT_Reports_Record_Earnings_for_Q2_2023″>More…
| 3Y Rev Growth | 3Y Operating Profit Growth | Operating Margin |
| – | – | -37.0% |
| FCF Margin | ROE | ROA |
| -30.5% | -13.6% | -9.1% |
Analysis – Smartrent Stock Fair Value Calculation
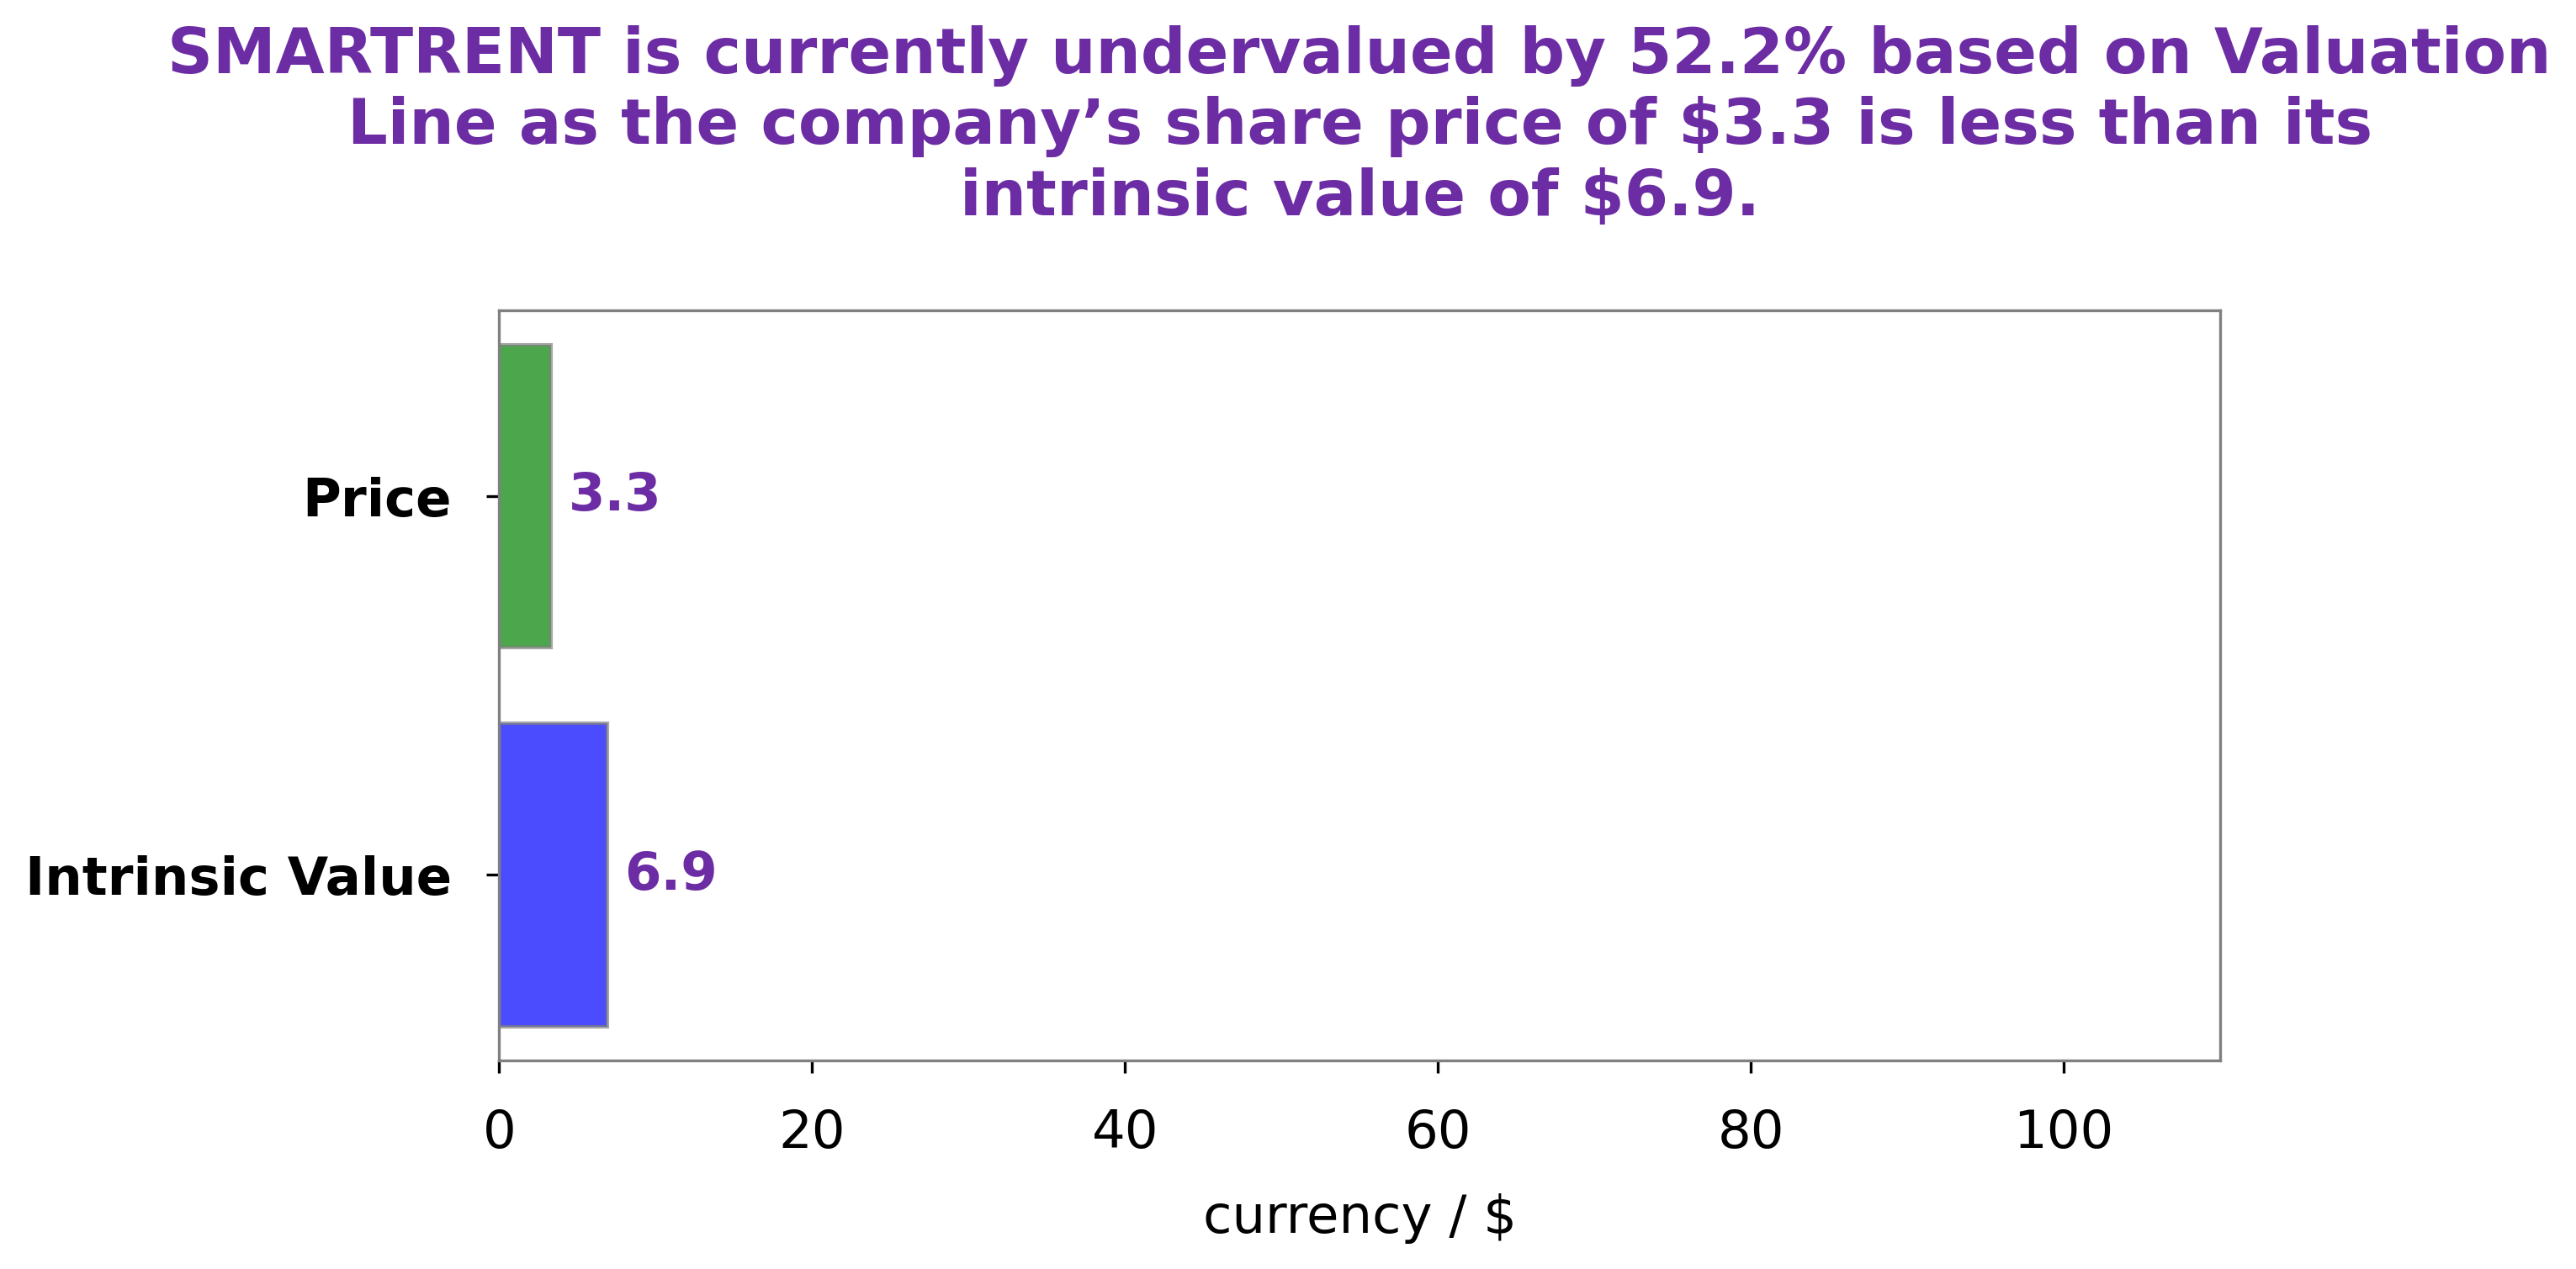
At GoodWhale, we have conducted an analysis of SMARTRENT‘s financials and believe that the fair value of the stock is around $7.9. This was calculated using our proprietary Valuation Line, which takes into account a range of financial factors. Currently, SMARTRENT stock is being traded at $3.6 – significantly lower than our estimated fair value of $7.9. This represents an undervaluation of 54.3%. We recommend taking a closer look at SMARTRENT’s financials to determine if investing in the company makes sense for you. More…
Peers
The competition in the smart home technology market is heating up. SmartRent Inc, a leading provider of smart home technology, is up against some stiff competition from the likes of iWOW Technology Ltd, Cepton Inc, and Guotai Epoint Sofware Co Ltd. While each company has its own strengths and weaknesses, it is clear that SmartRent Inc is the one to watch in this space.
– iWOW Technology Ltd ($SGX:NXR)
As of 2022, iWOW Technology Ltd has a market cap of 60.1M and a Return on Equity of 38.22%. The company provides technology solutions for the home entertainment industry. Its products include home theater systems, Blu-ray players, and streaming media players.
– Cepton Inc ($NASDAQ:CPTN)
As of 2022, Cepton Inc has a market capitalization of 384.35 million and a return on equity of 31.21%. The company is a leading provider of 3D sensing solutions for a variety of applications, including automotive, industrial, consumer, and security. Cepton’s 3D sensing technology enables customers to create products and experiences that were not possible before, and the company is committed to delivering the highest quality 3D sensing solutions to its customers.
– Guotai Epoint Sofware Co Ltd ($SHSE:688232)
Guotai Epoint Sofware Co Ltd is a Chinese software company with a market cap of 19.96B as of 2022. The company has a Return on Equity of 7.68%. Guotai Epoint Sofware Co Ltd develops software for the financial industry. The company’s products include banking software, securities software, and insurance software.
Summary
Investors responded negatively to SMARTRENT‘s second quarter earnings report for the 2023 fiscal year, released on August 8th. Total revenue was up 25.9% from the same quarter a year ago, reaching 53.4 million USD.
However, net income was -10.4 million, a significant improvement from the -25.6 million loss in the same quarter the year before. This news caused the stock price to drop on the same day. Analysts have expressed caution when considering investing in SMARTRENT, citing the company’s recent weak financial performance and uncertain outlook. Investors should carefully evaluate its risk-reward profile before investing in the company.


