Shell Plc Intrinsic Value Calculator – SHELL PLC Reports Q2 FY2023 Earnings Results on July 27, 2023
August 27, 2023

🌥️Earnings Overview
On July 27 2023, SHELL PLC ($NYSE:SHEL) released their earnings results for the second quarter of FY2023, as of June 30 2023. Total revenue was USD 74.6 billion, representing a 25.5% decrease year-over-year. Net income reported for the quarter was USD 3.1 billion, an 82.6% drop from the same period in the preceding year.
Share Price
On Thursday, July 27, 2023, SHELL PLC reported its second quarter financial results for fiscal year 2023. The opening stock price of SHELL PLC was $61.6 and the stock closed at $60.8, a decrease of 2.9% from the previous closing price of 62.6. The results showed a decrease in revenue, earnings per share and operating cash flow compared to previous quarters. Analysts had expected a more positive performance as the company had recently introduced a range of new products and services.
However, the figures reveal that the company’s strategies had not yet delivered the desired results. SHELL PLC’s management team is now working to focus on improving the operational efficiency of the business in order to provide better returns for shareholders. SHELL PLC has also announced its plans to focus on its sustainability goals and to reduce its environmental footprint. The company has committed to making investments in renewable energy projects, reducing its carbon emissions and investing in green technologies. These investments are expected to help the company make progress towards its sustainability goals and create long-term value for its shareholders. Overall, while SHELL PLC reported lower than expected earnings for the second quarter, investors are hopeful that the company’s efforts to improve its operations and focus on sustainability will lead to better results in the future. Live Quote…
About the Company
Income Snapshot
Below shows the total revenue, net income and net margin for Shell Plc. More…
| Total Revenues | Net Income | Net Margin |
| 358.59k | 29k | 9.4% |
Cash Flow Snapshot
Below shows the cash from operations, investing and financing for Shell Plc. More…
| Operations | Investing | Financing |
| 64.23k | -19.22k | -39.17k |
Balance Sheet Snapshot
Below shows the total assets, liabilities and book value per share for Shell Plc. More…
| Total Assets | Total Liabilities | Book Value Per Share |
| 415.03k | 222.94k | 56.56 |
Key Ratios Snapshot
Some of the financial key ratios for Shell Plc are shown below. More…
| 3Y Rev Growth | 3Y Operating Profit Growth | Operating Margin |
| 10.9% | 40.1% | 14.4% |
| FCF Margin | ROE | ROA |
| 11.6% | 16.8% | 7.8% |
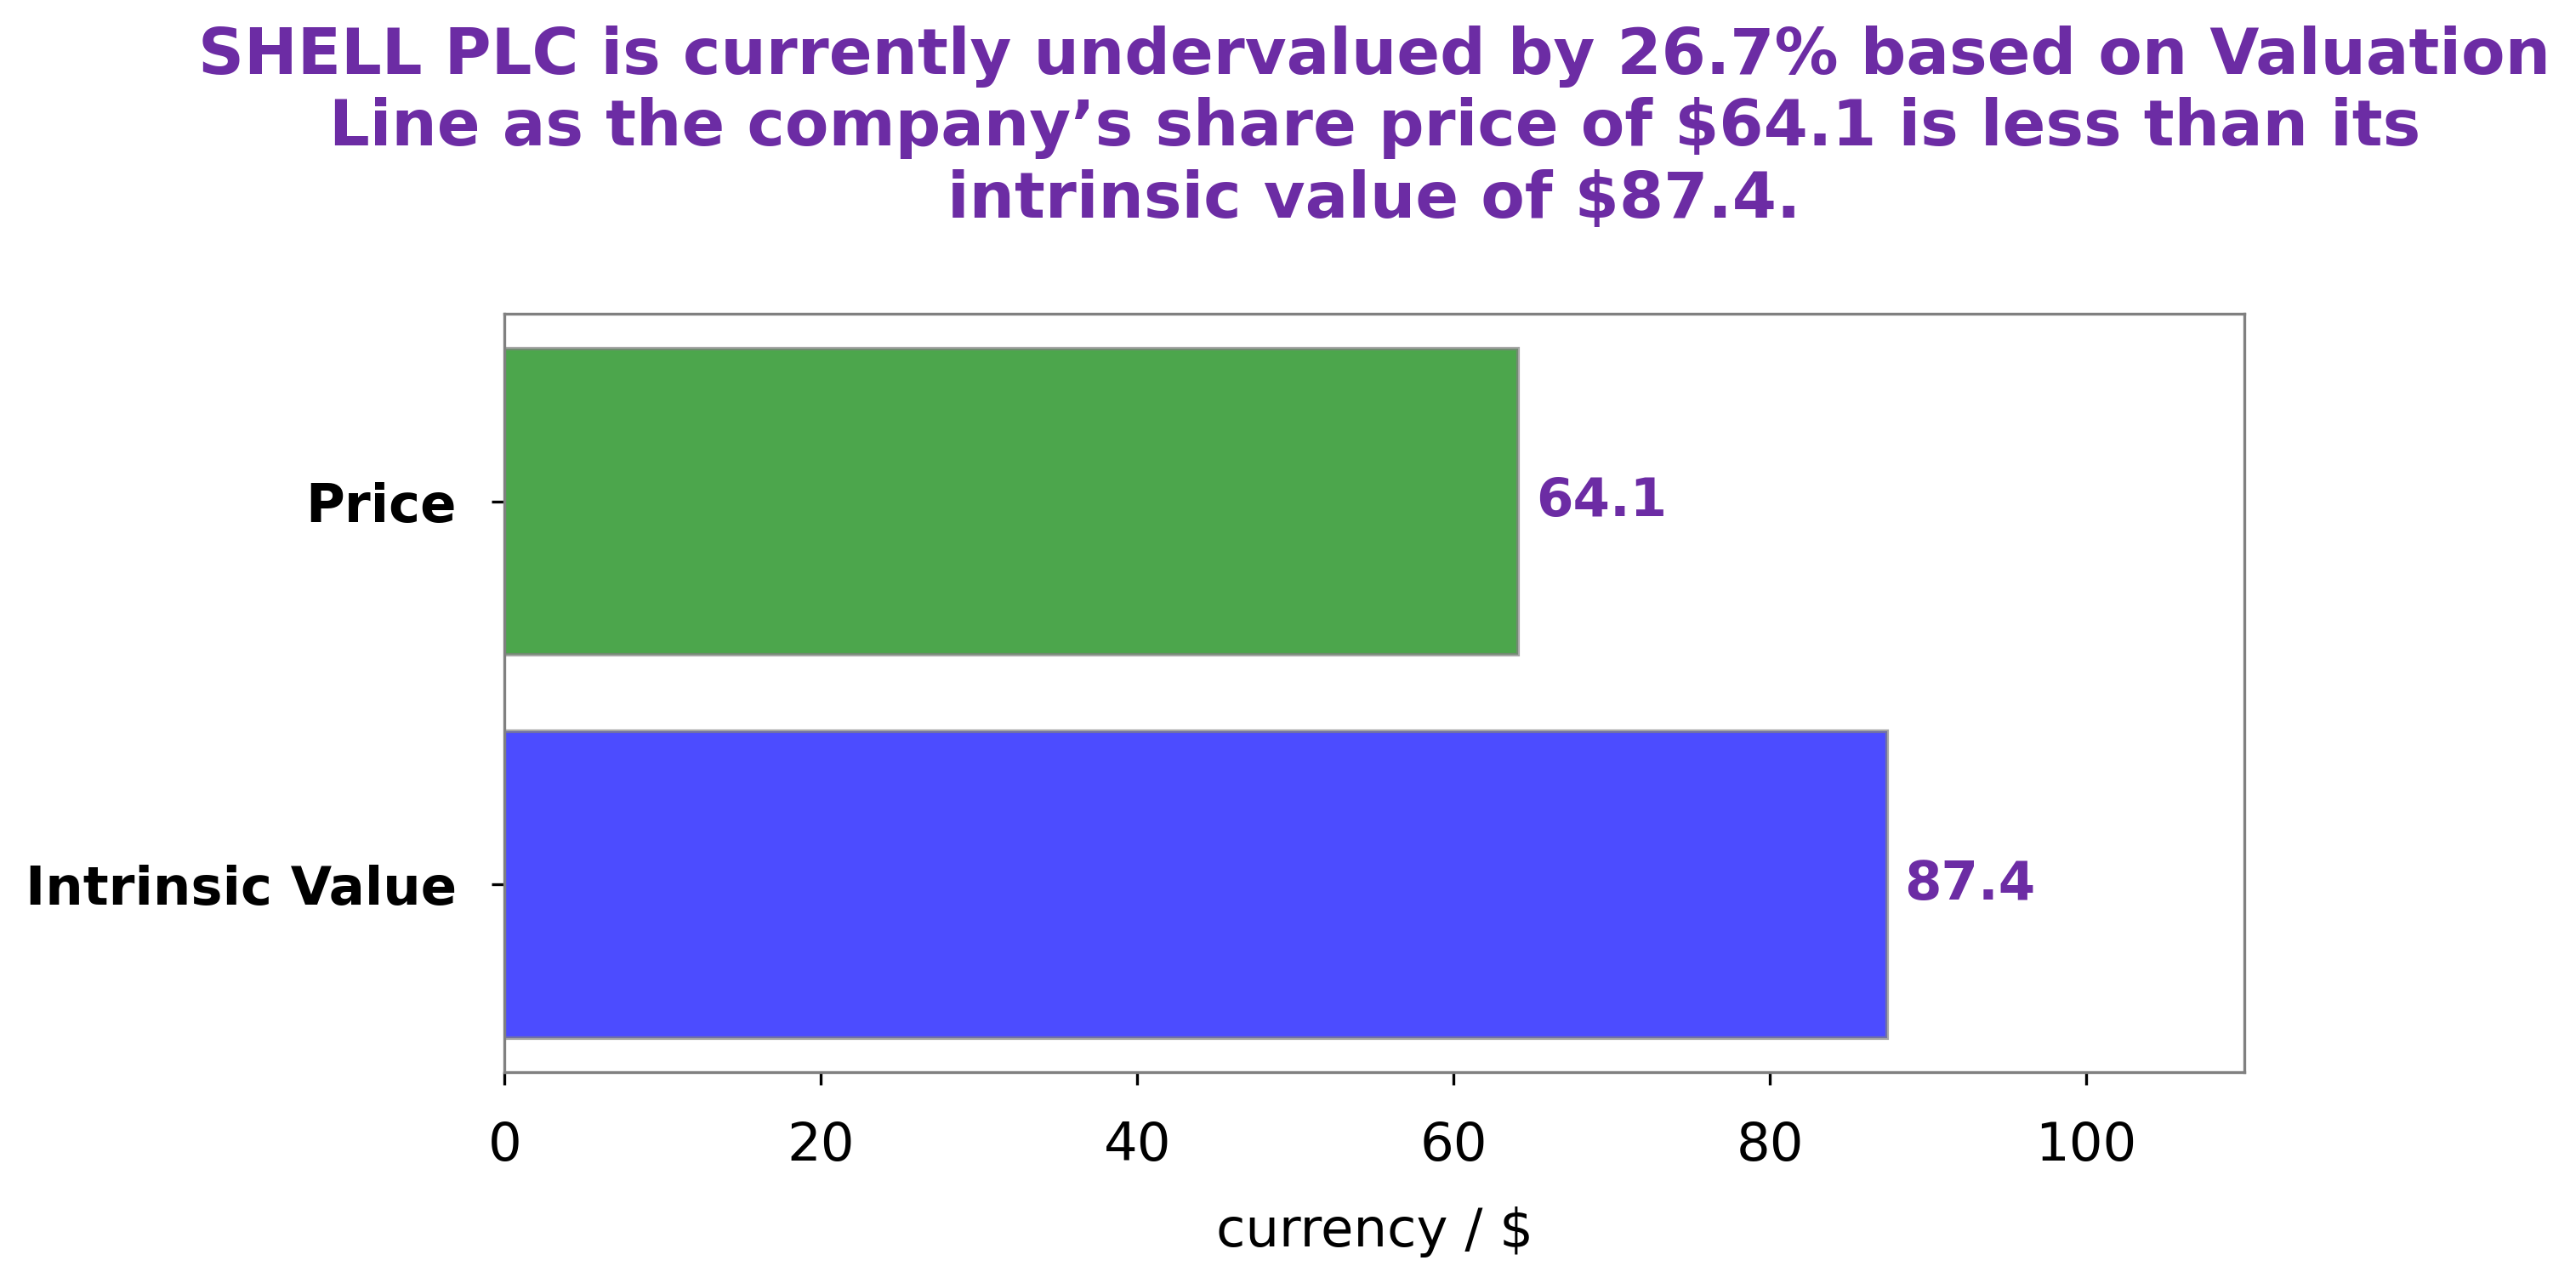
Analysis – Shell Plc Intrinsic Value Calculator
At GoodWhale, we have conducted an analysis of SHELL PLC‘s financials and have determined that the fair value of its shares is around $60.8. This valuation has been calculated by our proprietary Valuation Line. At the time of writing, SHELL PLC stock is being traded at $60.8, which is a fair price given our analysis and assessment of its current financial state. More…
Summary
SHELL PLC reported their second quarter earnings for FY2023, ending June 30 2023, on July 27 2023. The total revenue was USD 74.6 billion, a decrease of 25.5%, while the net income reported for the quarter was USD 3.1 billion, a decrease of 82.6% from the corresponding period of the previous year. This decline in revenue and net income indicates that investors should be cautious when considering SHELL PLC for their portfolios, as it may not be able to generate returns in the short-term. Investors should analyze potential risks and rewards associated with the company before committing to an investment in the company.


