SANDRIDGE ENERGY Reports Second-Quarter Earnings Results for FY2023
August 29, 2023

☀️Earnings Overview
SANDRIDGE ENERGY ($NYSE:SD) released their second-quarter earnings for FY2023 on June 30 2023, revealing a decrease of 52.1% in total revenue from the same period in the previous year, at USD 33.4 million. Net income was also down 65.7% year-over-year, with a total of USD 16.6 million.
Price History
The company’s stock opened at $17.0 and closed at $16.6, down by 2.8% from its last closing price of 17.1. This is a significant drop and signals a potentially struggling financial performance for the company. This is a significant improvement, but it still indicates that the company is facing financial difficulties.
Overall, SANDRIDGE ENERGY‘s second-quarter financial performance was not as strong as expected and the stock saw a sharp decline as a result. The company will need to make some strategic changes in order to improve its financial situation and remain competitive in the energy sector. Live Quote…
About the Company
Income Snapshot
Below shows the total revenue, net income and net margin for Sandridge Energy. More…
| Total Revenues | Net Income | Net Margin |
| 203.58 | 199.35 | 95.4% |
Cash Flow Snapshot
Below shows the cash from operations, investing and financing for Sandridge Energy. More…
| Operations | Investing | Financing |
| 149.39 | -55.01 | -75.54 |
Balance Sheet Snapshot
Below shows the total assets, liabilities and book value per share for Sandridge Energy. More…
| Total Assets | Total Liabilities | Book Value Per Share |
| 562.06 | 107.36 | 12.3 |
Key Ratios Snapshot
Some of the financial key ratios for Sandridge Energy are shown below. More…
| 3Y Rev Growth | 3Y Operating Profit Growth | Operating Margin |
| 5.1% | 31.1% | 63.0% |
| FCF Margin | ROE | ROA |
| 45.6% | 16.6% | 14.3% |
Analysis
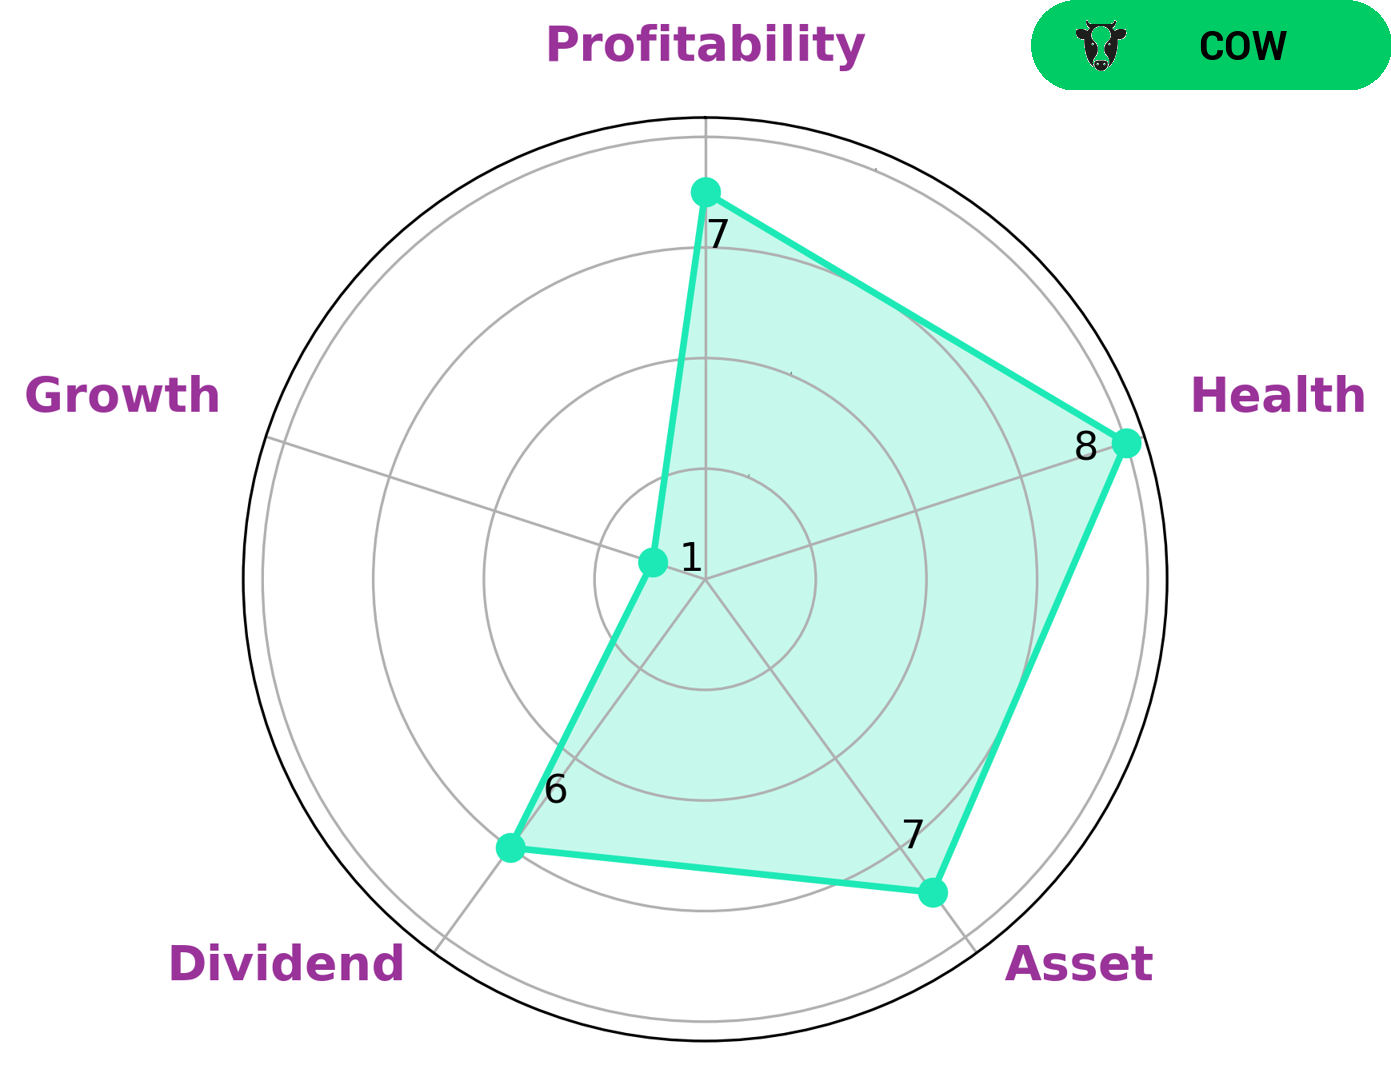
At GoodWhale, we conducted a financial analysis on SANDRIDGE ENERGY and used our Star Chart to classify the company as a ‘cow’. This type of company typically has a track record of paying out consistent and sustainable dividends, making it an attractive investment opportunity for investors looking for a steady income stream. SANDRIDGE ENERGY has a high health score of 8/10 with regard to its cashflows and debt, suggesting that the company is capable of paying off debt and funding future operations. Moreover, the company is strong in asset, profitability, and medium in dividend, although it is weak in growth. All these factors make SANDRIDGE ENERGY an attractive investment opportunity for investors looking for both steady income and long-term growth. More…
Peers
SandRidge Energy Inc is an American oil and natural gas company headquartered in Oklahoma City, Oklahoma. As of December 31, 2015, the company had 1,206.6 million barrels of oil equivalent of estimated proved reserves, of which 55% was petroleum, 41% was natural gas and 4% was natural gas liquids. The company also had estimated proved reserves of 2,473.5 Mboe in Canada. The company’s estimated proved reserves were primarily located in the Mid-Continent, Mississippi, Gulf Coast and Permian Basin regions.
– Traverse Energy Ltd ($TSX:PNE)
Pine Cliff Energy is a Canadian oil and gas company with a market cap of $589.7 million as of 2022. The company has a return on equity of 77.26%. Pine Cliff Energy is engaged in the exploration, development, production and marketing of natural gas and crude oil in Alberta and British Columbia, Canada.
– Pine Cliff Energy Ltd ($TSXV:SCD)
The company’s market cap is $1.37 million and its ROE is 11.39%. The company is involved in the exploration and production of oil and gas.
Summary
SANDRIDGE ENERGY reported a decrease in total revenue of 52.1% for their second-quarter earnings results for FY2023, compared to the same quarter in the previous year. Net income also saw a significant decrease of 65.7% year-over-year. Despite this, the company is still a viable investment opportunity for those looking to diversify their portfolio and capitalize on the potential upside in the energy sector. Investors should conduct due diligence and understand the risks associated with investing in SANDRIDGE ENERGY before investing.


