Ppg Industries Intrinsic Value Calculation – PPG INDUSTRIES Reports Second Quarter FY2023 Earnings Results for June 30 2023
July 22, 2023

🌥️Earnings Overview
On July 20, 2023, PPG INDUSTRIES ($NYSE:PPG) announced its second quarter earnings results for the fiscal year ending June 30, 2023. The reported total revenue was USD 4872.0 million, registering a year-on-year growth of 3.9%. Net income was USD 490.0 million, an 11.1% increase from the same quarter of the prior year.
Stock Price
The company’s stock opened at $150.2 and closed at $149.7, representing a 0.4% dip from its prior closing price of 150.3. PPG Industries is an international supplier of paints, coatings, and specialty materials, providing customers with innovative and sustainable solutions. Over the last quarter, the company has seen positive results in sales growth and profit margins. In addition to releasing their second quarter earnings, PPG Industries also announced their plans to restructure their businesses in some markets to better meet customer needs. This restructuring plan could help the company to remain competitive in the industry and continue to grow profits in the long-term.
This demonstrates that PPG Industries is continuing to make progress towards their long-term goals of increased profitability and growth. Overall, PPG Industries is showing signs of financial health with their second quarter earnings report. The company’s restructuring plans and focus on customer needs should ensure that they remain competitive in the industry and continue to generate strong profits over time. Live Quote…
About the Company
Income Snapshot
Below shows the total revenue, net income and net margin for Ppg Industries. More…
| Total Revenues | Net Income | Net Margin |
| 17.91k | 1.32k | 7.5% |
Cash Flow Snapshot
Below shows the cash from operations, investing and financing for Ppg Industries. More…
| Operations | Investing | Financing |
| 1.72k | -461 | -409 |
Balance Sheet Snapshot
Below shows the total assets, liabilities and book value per share for Ppg Industries. More…
| Total Assets | Total Liabilities | Book Value Per Share |
| 22.1k | 14.85k | 30.34 |
Key Ratios Snapshot
Some of the financial key ratios for Ppg Industries are shown below. More…
| 3Y Rev Growth | 3Y Operating Profit Growth | Operating Margin |
| 8.8% | 5.5% | 11.0% |
| FCF Margin | ROE | ROA |
| 8.2% | 17.2% | 5.5% |
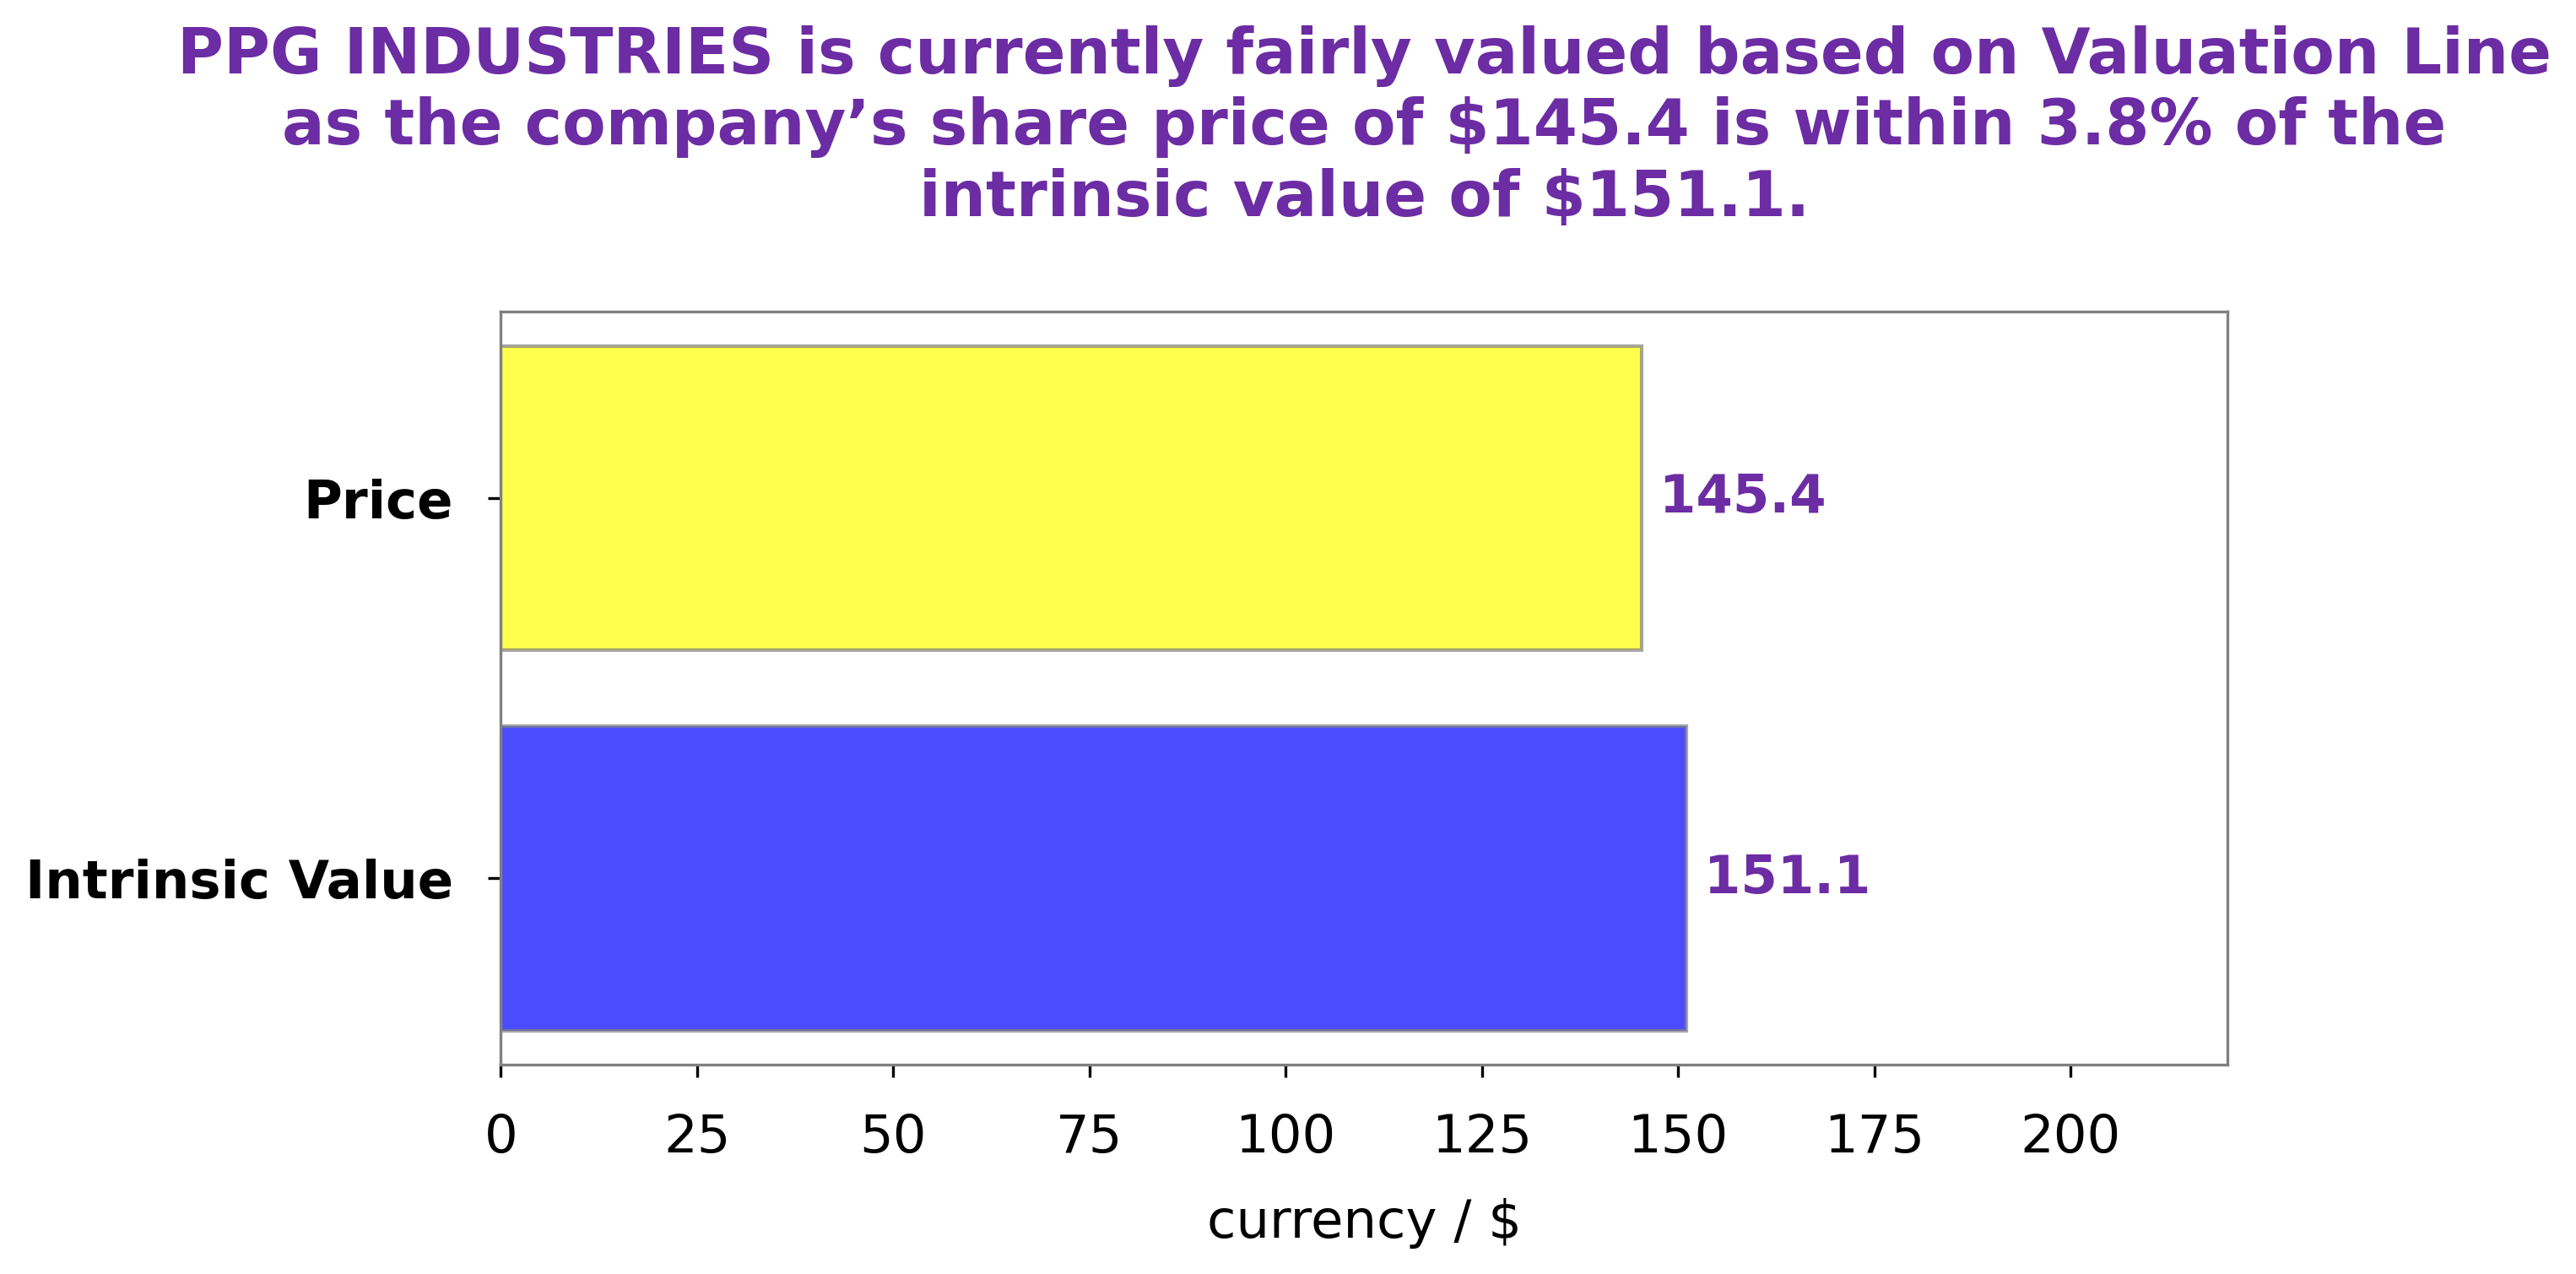
Analysis – Ppg Industries Intrinsic Value Calculation
At GoodWhale, we have conducted an analysis of PPG INDUSTRIES‘s wellbeing. Using our proprietary Valuation Line, we have calculated the intrinsic value of PPG INDUSTRIES share to be around $153.2. At present, PPG INDUSTRIES stock is being traded at $149.7, which is a fair price but undervalued by 2.3%. We recommend investors watch the stock closely, as it could be an opportunity for them to benefit from the current price discrepancy. More…
Peers
PPG Industries Inc and its competitors Trinseo PLC, LyondellBasell Industries NV, Covestro AG are all engaged in a fierce competition to be the leading chemical company globally. All four companies have their own unique strengths and weaknesses, and each is trying to gain an edge over the others. The competition between these companies is expected to heat up even further in the coming years.
– Trinseo PLC ($NYSE:TSE)
Trinseo PLC is a global materials company with a market cap of 630.21M as of 2022. The company has a strong focus on sustainability and is committed to being a force for good in the world. Trinseo’s products are used in a wide variety of applications, including automotive, consumer electronics, and construction. The company has a strong focus on research and development, and is constantly innovating to bring new and better products to market. Trinseo’s return on equity is 20.36%.
– LyondellBasell Industries NV ($NYSE:LYB)
LyondellBasell Industries NV is a Netherlands-based company engaged in the production of chemicals and polymers. The Company’s product portfolio includes olefins and polyolefins, and a range of derived products. LyondellBasell Industries NV, through its subsidiaries, operates in Europe, the United States, Asia Pacific, the Middle East and Africa.
– Covestro AG ($OTCPK:COVTY)
Covestro AG is a world-leading producer of high-performance polymers. The company’s innovative and sustainable products are used in a wide range of industries, from construction and electronics to sports and leisure. Covestro is headquartered in Leverkusen, Germany, and has around 16,800 employees worldwide. The company’s market cap is 6.67B as of 2022, and it has a return on equity of 14.83%. Covestro is a publicly traded company on the Frankfurt Stock Exchange.
Summary
PPG Industries has reported impressive results in their second quarter earnings for FY2023. Total revenue was USD 4872.0 million, an increase of 3.9% year-on-year, while net income was USD 490.0 million, a 11.1% increase from the same quarter last year. This impressive showing suggests that PPG Industries is in a strong position for continued growth and profitability.
For investors, PPG Industries should be seen as an attractive option for long-term investments, with strong potential for future dividend payments and capital appreciation. With their resilient performance and commitment to shareholders, PPG Industries is certainly a stock worth considering.


