Phreesia Stock Fair Value – PHREESIA Reports Strong Earnings for Second Quarter of FY2024
September 8, 2023

☀️Earnings Overview
On July 31, 2023, PHREESIA ($NYSE:PHR) released their financial results for the second quarter of Fiscal Year 2024. Their total revenue for the quarter was USD 85.8 million, a 26.5% increase from the same quarter in the prior year. Net income for the quarter improved to -36.8 million, as compared to -46.7 million in the same quarter a year ago.
Market Price
On Wednesday, PHREESIA, a leading healthcare technology company, reported strong earnings for the second quarter of FY2024. PHREESIA’s stock opened at $30.3 and closed at $30.4, up by 1.2% from its last closing price of $30.0. This increase represents a strong show of confidence in the company’s future prospects. PHREESIA’s strong earnings were driven by increased revenue from its suite of patient intake solutions that help healthcare providers streamline their patient onboarding process.
In addition, the company also reported strong user growth and adoption of its mobile applications, which enable patients to easily access and manage their health information. PHREESIA’s success reflects its commitment to developing innovative technology solutions that empower healthcare providers to deliver the best care possible for their patients. The company’s success is also a testament to its focus on delivering value to customers through comprehensive customer service, robust security measures, and a reliable infrastructure. Looking forward, PHREESIA plans to continue its efforts to develop and deliver innovative healthcare technology solutions to empower medical providers and enable an enhanced patient experience. Live Quote…
About the Company
Income Snapshot
Below shows the total revenue, net income and net margin for Phreesia. More…
| Total Revenues | Net Income | Net Margin |
| 319.36 | -152.49 | -47.7% |
Cash Flow Snapshot
Below shows the cash from operations, investing and financing for Phreesia. More…
| Operations | Investing | Financing |
| -59.64 | -29.12 | -24.29 |
Balance Sheet Snapshot
Below shows the total assets, liabilities and book value per share for Phreesia. More…
| Total Assets | Total Liabilities | Book Value Per Share |
| 340.44 | 93.42 | 4.48 |
Key Ratios Snapshot
Some of the financial key ratios for Phreesia are shown below. More…
| 3Y Rev Growth | 3Y Operating Profit Growth | Operating Margin |
| 33.6% | – | -47.7% |
| FCF Margin | ROE | ROA |
| -26.6% | -37.3% | -28.0% |
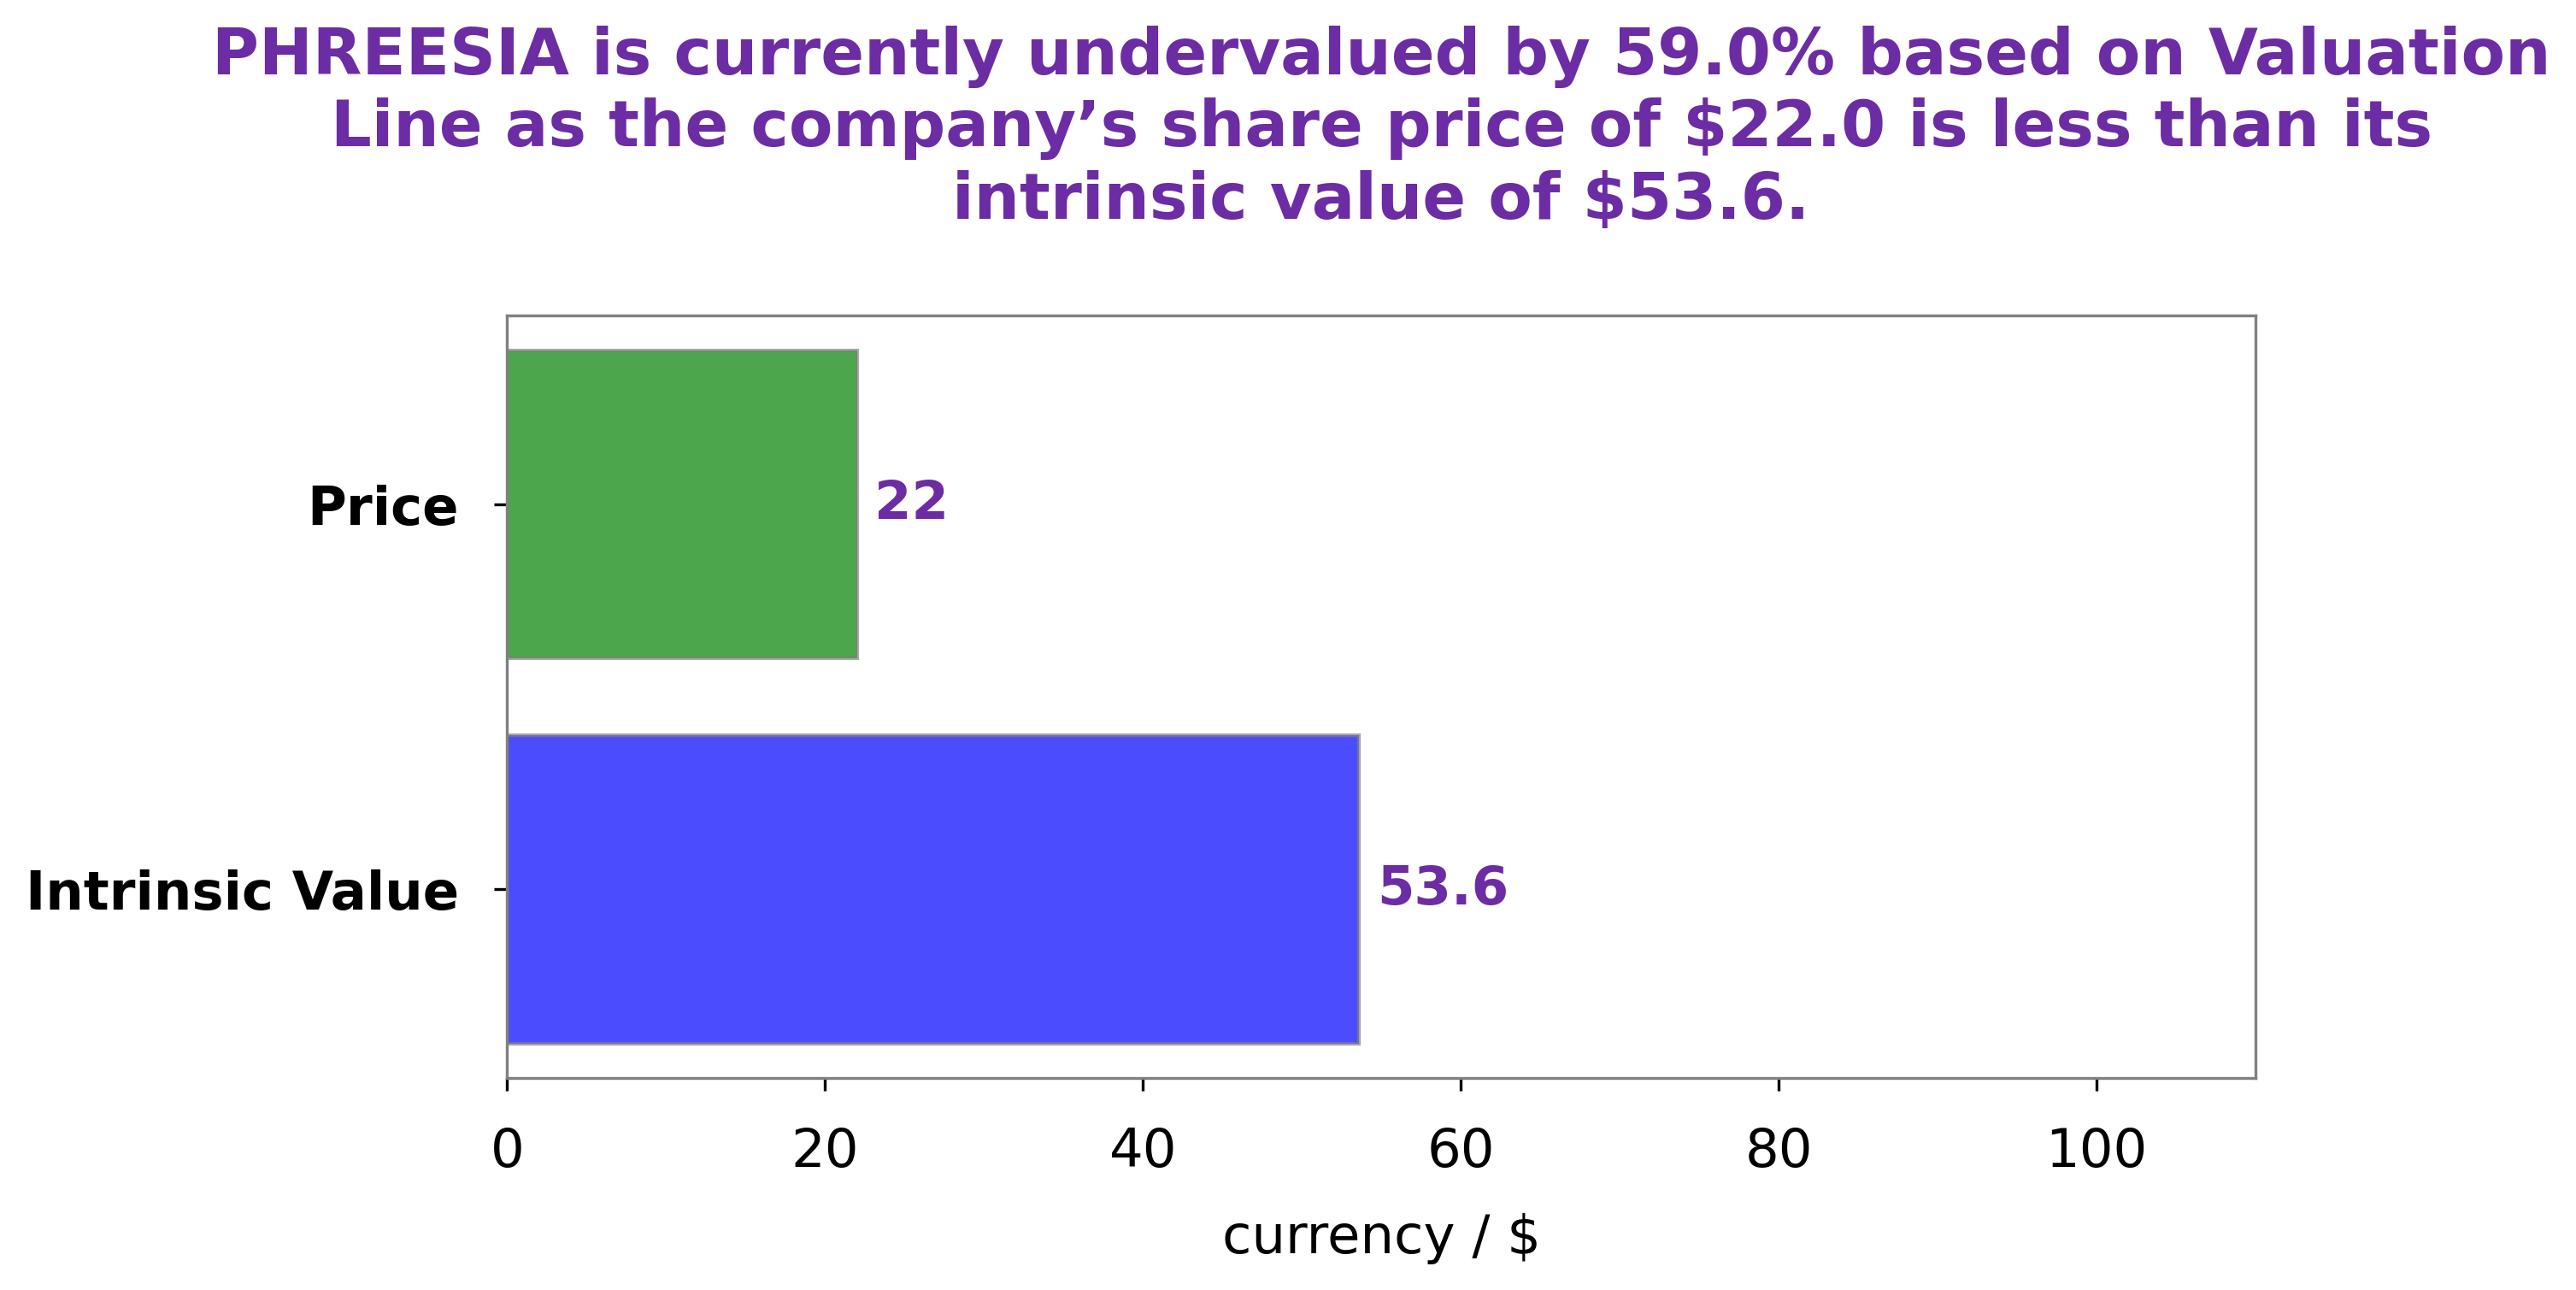
Analysis – Phreesia Stock Fair Value
At GoodWhale, we have used our proprietary Valuation Line to conduct a comprehensive analysis of PHREESIA‘s financials. Our calculations indicate that the intrinsic value of PHREESIA share is approximately $53.7. This means that, currently, PHREESIA stock is being traded at $30.4, which is 43.4% lower than its true worth. This presents an attractive opportunity for investors to buy the stock at a discount. We believe that this investment could prove to be quite lucrative in the long run. More…
Peers
Its competitors include Sharecare Inc, Aclarion Inc, and Cloud DX Inc.
– Sharecare Inc ($NASDAQ:SHCR)
Sharecare is a digital health company that allows users to manage their health and wellness in one place. The company has a wide range of products and services, including a social media platform, a health information database, and a mobile app. The company also offers a variety of health and wellness products and services, including fitness tracking, nutrition counseling, and stress management.
– Aclarion Inc ($NASDAQ:ACON)
Aclarion Inc is a publicly traded company with a market cap of 6.36M as of 2022. The company has a Return on Equity of -186.66%. Aclarion is a provider of cloud-based software solutions for the management of enterprise content. The company’s products and services include content management, document management, records management, and compliance management. Aclarion’s solutions are used by organizations in a variety of industries, including healthcare, financial services, government, and education.
– Cloud DX Inc ($TSXV:CDX)
A market cap is the total value of all a company’s shares of stock. Market cap is calculated by multiplying a company’s shares outstanding by the current market price of one share. The return on equity is a financial ratio that measures the profitability of a company in relation to the equity. The company’s equity is the difference between its total assets and total liabilities. The company’s ROE is its net income divided by its equity.
The company’s market cap is 10.81M as of 2022. The company’s ROE is 111.76%. The company’s net income is its total assets minus its total liabilities. The company’s market cap is its shares outstanding multiplied by the current market price of one share.
Summary
PHREESIA, a provider of software solutions for the healthcare industry, has reported their second quarter of FY2024 earnings results. Total revenue for the quarter was USD 85.8 million, up 26.5% year-on-year. Net income showed an improvement from -46.7 million in the same quarter last year to -36.8 million. Investors could see potential in the company as its total revenue continues to increase and its net losses decline.
However, PHREESIA’s financial performance should be further monitored in order to assess its long-term prospects as a potential investment opportunity.


