PEABODY ENERGY Reports Q2 Financial Results for 2023 Fiscal Year
August 27, 2023

☀️Earnings Overview
On July 27, 2023, PEABODY ENERGY ($NYSE:BTU) released their financial report for Q2 of the 2023 fiscal year (ending June 30, 2023). Compared to the year prior, the company saw a 4.0% decrease in total revenue, amounting to USD 1268.8 million. Meanwhile, net income experienced an even steeper drop of 56.2%, amounting to USD 179.2 million.
Market Price
The company’s stock opened on Thursday at $21.7 and closed at the same price, down 3.3% from its last closing price of $22.4. The increase in net income was mainly attributed to higher sales of coal and other minerals, as well as cost-cutting measures implemented during the quarter. This was mainly due to strong cash flow performance, driven by higher sales and cost savings initiatives during the quarter.
Overall, Peabody Energy reported a good quarter, with improved financials and higher cash flows. This good performance should help boost the company’s stock price going forward. Live Quote…
About the Company
Income Snapshot
Below shows the total revenue, net income and net margin for Peabody Energy. More…
| Total Revenues | Net Income | Net Margin |
| 5.6k | 1.45k | 27.0% |
Cash Flow Snapshot
Below shows the cash from operations, investing and financing for Peabody Energy. More…
| Operations | Investing | Financing |
| 1.9k | -243.2 | -982.1 |
Balance Sheet Snapshot
Below shows the total assets, liabilities and book value per share for Peabody Energy. More…
| Total Assets | Total Liabilities | Book Value Per Share |
| 5.83k | 2.3k | 23.81 |
Key Ratios Snapshot
Some of the financial key ratios for Peabody Energy are shown below. More…
| 3Y Rev Growth | 3Y Operating Profit Growth | Operating Margin |
| 14.9% | 83.7% | 31.3% |
| FCF Margin | ROE | ROA |
| 29.0% | 31.7% | 18.8% |
Analysis
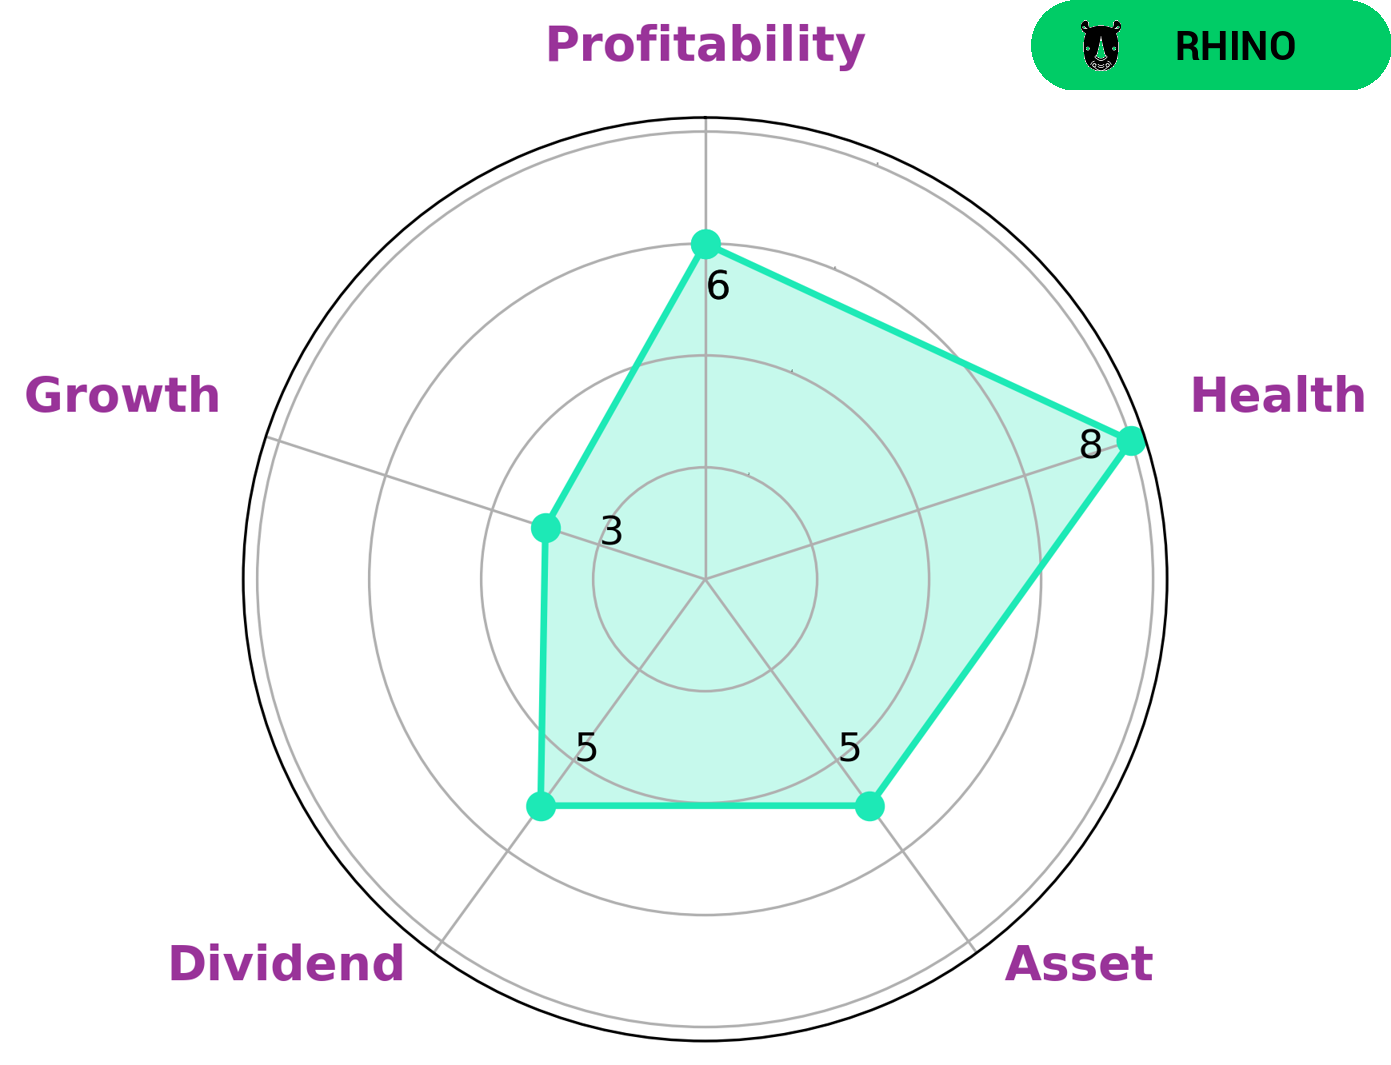
At GoodWhale, we took the time to analyze the financials of PEABODY ENERGY with our assistance. Through our Star Chart analysis, we can conclude that PEABODY ENERGY is strong in asset and medium in dividend, growth, and profitability. As PEABODY ENERGY is classified as a ‘gorilla’ type of company, we can infer that it achieved stable and high revenue or earning growth due to its strong competitive advantage. This type of company may be interesting for investors who like to invest in long-term projects with sustained success. Additionally, PEABODY ENERGY has a high health score of 8/10 when taking its cashflows and debt into consideration, making it capable to sustain future operations in times of crisis. More…
Peers
In the coal industry, there is stiff competition among the top companies. Peabody Energy Corp, Alliance Resource Partners LP, CONSOL Energy Inc, and Arch Resources Inc are all vying for a piece of the pie. Each company has its own strengths and weaknesses, and it is up to the consumer to decide which company they want to support.
– Alliance Resource Partners LP ($NASDAQ:ARLP)
Alliance Resource Partners LP is a leading producer and marketer of coal in the United States. The company has a market cap of $3.06 billion and a return on equity of 19.31%. Alliance Resource Partners LP is engaged in the business of mining, processing and selling coal to electric utilities and metallurgical coal customers. The company operates mines in Illinois, Indiana, Kentucky, Maryland, Pennsylvania, Virginia and West Virginia.
– CONSOL Energy Inc ($NYSE:CEIX)
CONSOL Energy Inc. is a coal and natural gas company. It has a market cap of 2.2B as of 2022 and a ROE of 40.18%. The company has a diversified portfolio of high-quality assets including the Marcellus Shale, the Utica Shale, the Barnett Shale, and the Appalachian Basin. The company is committed to providing safe and reliable energy to its customers and is one of the largest producers of both coal and natural gas in the United States.
– Arch Resources Inc ($NYSE:ARCH)
Arch Resources, Inc. operates as a metallurgical coal and thermal coal producer for the steel and power generation industries. It owns and operates coal mines in Wyoming, Colorado, West Virginia, Kentucky, Virginia, and Illinois. As of December 31, 2020, the company had estimated recoverable reserves of 1.1 billion tons of coal. Arch Resources, Inc. was founded in 1969 and is headquartered in St. Louis, Missouri.
Summary
PEABODY ENERGY reported disappointing financial results for the second quarter of 2023, with total revenue decreasing by 4.0% and net income dropping by 56.2% compared to the same period last year. This news led to a decline in the company’s stock price on the day of the announcement. With such underwhelming performance, investors should carefully consider the risks and potential returns of investing in PEABODY ENERGY shares. Potential investors should look over the company’s financials in detail and assess its future prospects before making any decision.
Related Posts


Recent Posts


