Olaplex Holdings Stock Fair Value – OLAPLEX HOLDINGS Reports Record Quarterly Financial Results for Fiscal Year 2023
August 12, 2023

🌥️Earnings Overview
On June 30, 2023, OLAPLEX HOLDINGS ($NASDAQ:OLPX) reported their financial results for Q2 of the 2023 fiscal year. Total revenue for the period was USD 109.2 million, which was a 48.2% decrease from the same quarter of the previous year. Net income decreased by 93.0% year-over-year and amounted to USD 6.2 million.
Share Price
This was a 9.5% drop from the stock’s previous closing price of $3.6. Overall, OLAPLEX HOLDINGS had a successful quarter, beating market expectations and delivering strong financial results. This was evident in their strong performance in both revenues and profits.
In spite of the decline in the closing stock price, the management of OLAPLEX HOLDINGS remains optimistic with their outlook for the rest of the fiscal year. They have attributed the decline to investors booking profits after the stock’s strong performance during the quarter, and are confident that they will be able to build on their past success and continue to deliver strong financial results going forward. Live Quote…
About the Company
Income Snapshot
Below shows the total revenue, net income and net margin for Olaplex Holdings. More…
| Total Revenues | Net Income | Net Margin |
| 530.2 | 121.52 | 22.9% |
Cash Flow Snapshot
Below shows the cash from operations, investing and financing for Olaplex Holdings. More…
| Operations | Investing | Financing |
| 202.36 | -3.73 | -18.23 |
Balance Sheet Snapshot
Below shows the total assets, liabilities and book value per share for Olaplex Holdings. More…
| Total Assets | Total Liabilities | Book Value Per Share |
| 1.72k | 905.07 | 1.25 |
Key Ratios Snapshot
Some of the financial key ratios for Olaplex Holdings are shown below. More…
| 3Y Rev Growth | 3Y Operating Profit Growth | Operating Margin |
| 68.1% | 82.6% | 36.2% |
| FCF Margin | ROE | ROA |
| 37.5% | 14.8% | 7.0% |
Analysis – Olaplex Holdings Stock Fair Value
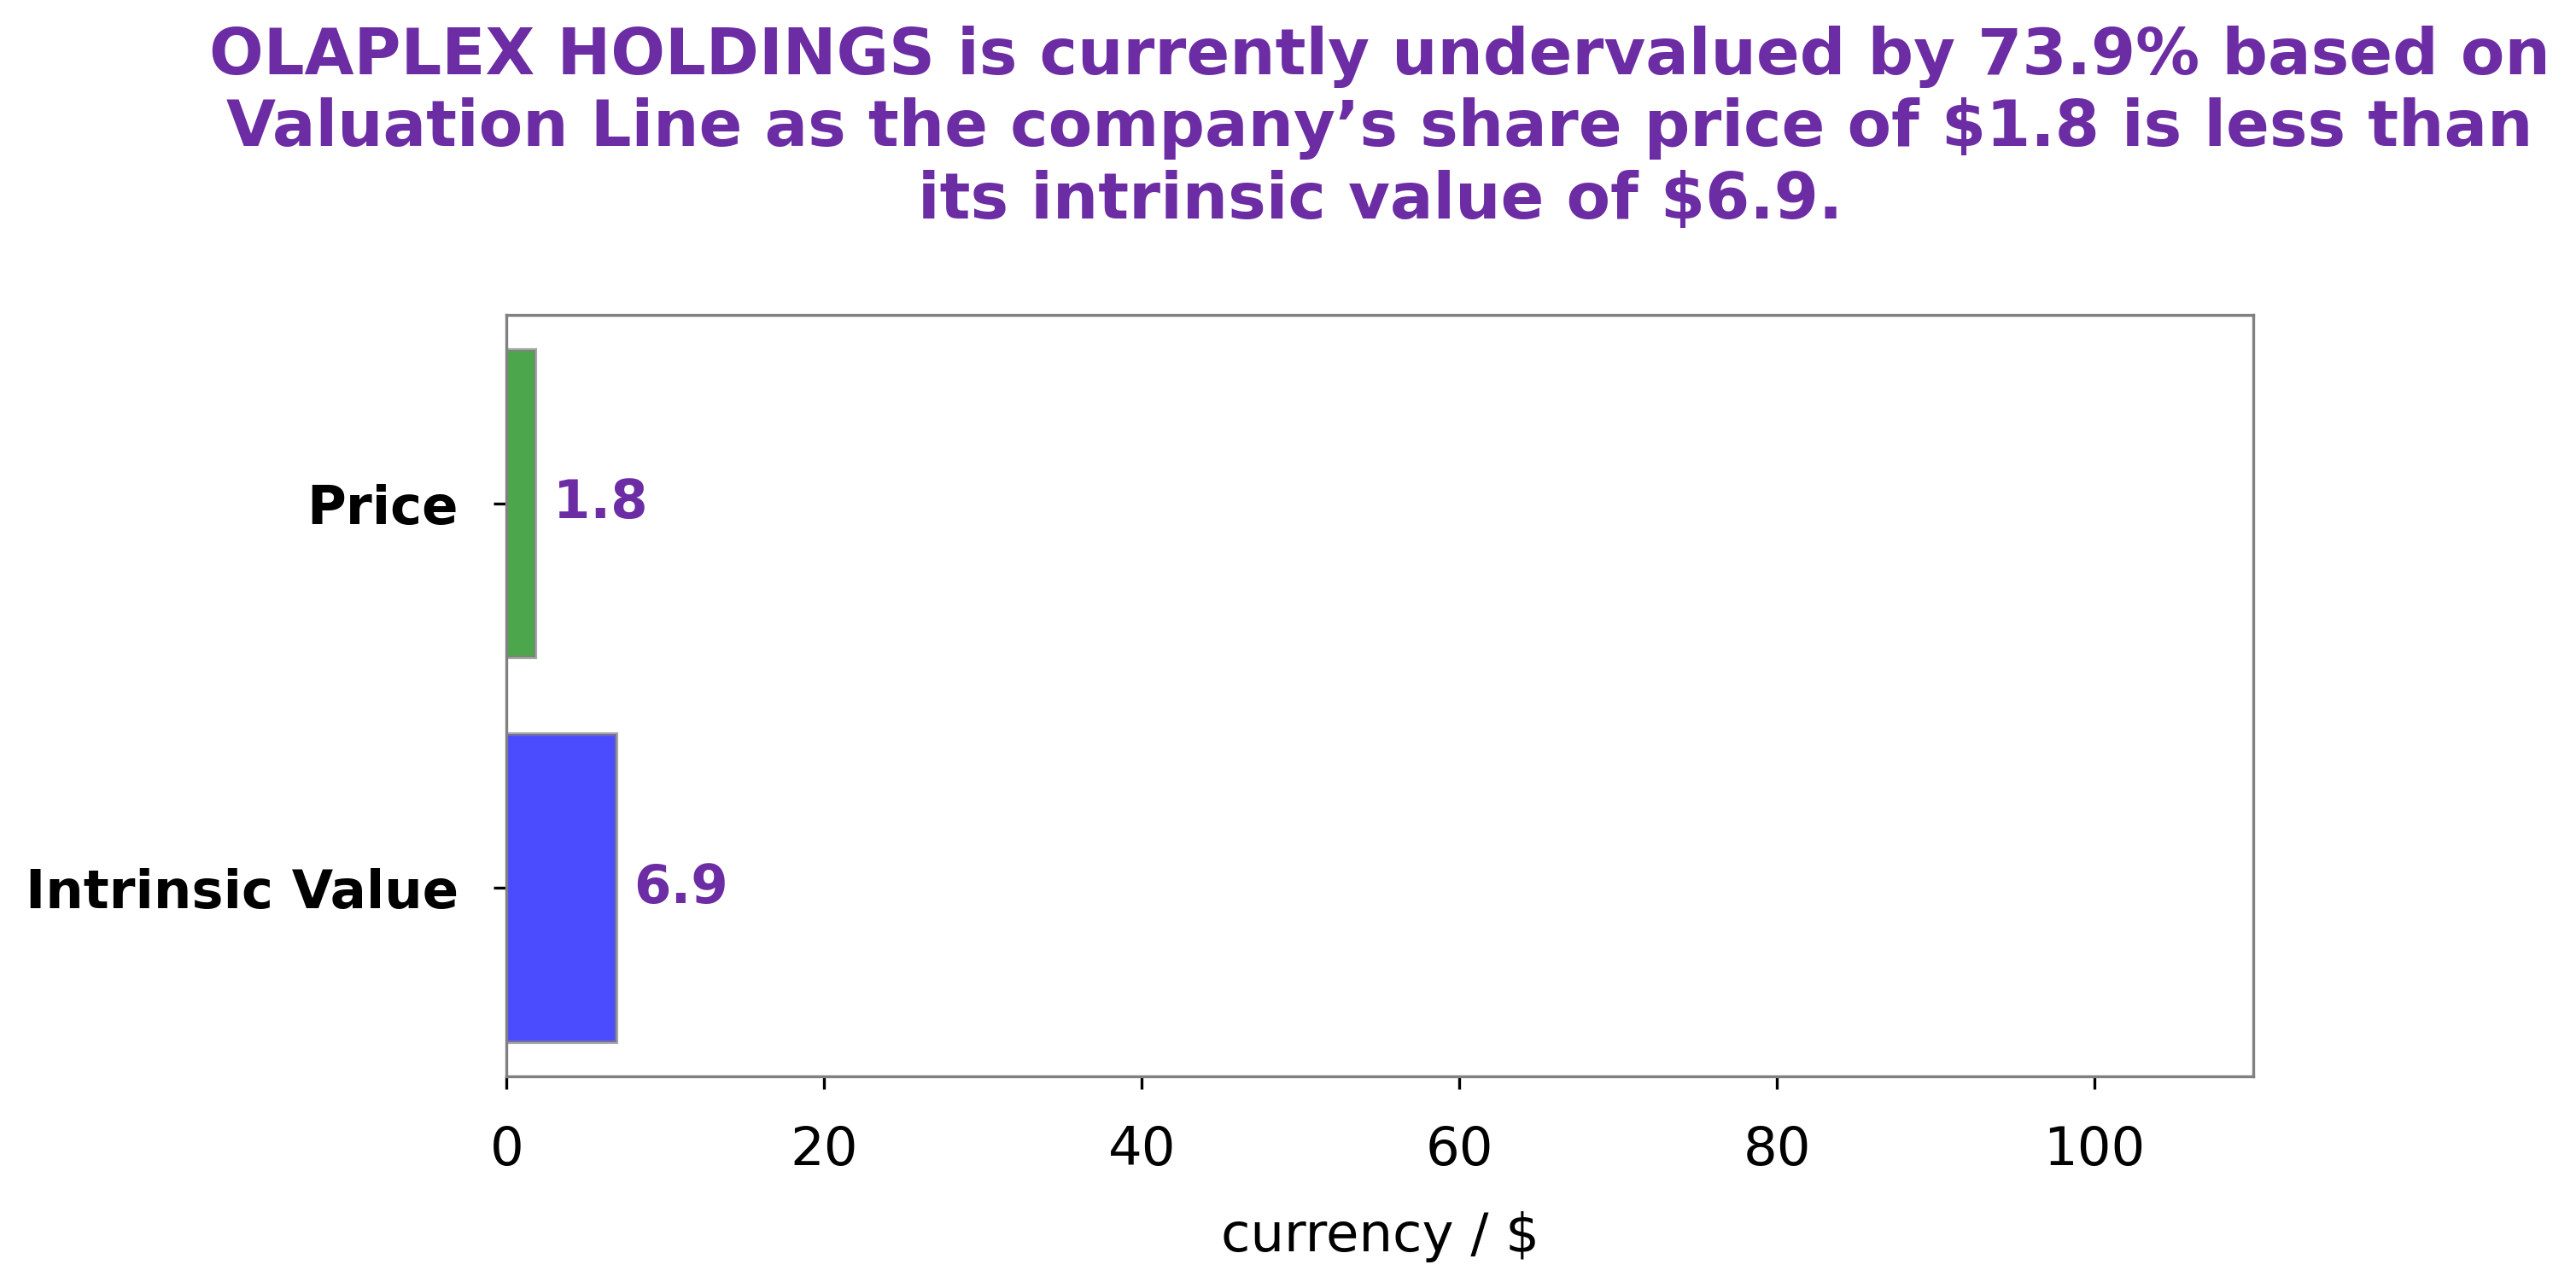
At GoodWhale, we’ve taken a deep dive into the fundamentals of OLAPLEX HOLDINGS and our proprietary Valuation Line has estimated their fair value to be around $9.8. This means that the stock is currently trading at $3.2, which represents a 67.3% discount to its intrinsic value. This makes it a great opportunity for investors looking for undervalued stocks. With a strong balance sheet, attractive valuation and solid growth potential, OLAPLEX HOLDINGS is one of the stocks we are recommending to our clients. More…
Peers
The market for hair care products has seen intense competition in recent years, with Olaplex Holdings Inc emerging as a major player. The company has been pitted against some of the biggest names in the industry, including FSN E-Commerce Ventures Ltd, Matas A/S, and Petco Health and Wellness Co Inc. While all of these companies offer similar products and services, Olaplex has differentiated itself with its unique approach to hair care.
– FSN E-Commerce Ventures Ltd ($BSE:543384)
FSN E-Commerce Ventures Ltd. is an online retailer that operates in the e-commerce industry. The company was founded in 2004 and is headquartered in Shenzhen, China. FSN E-Commerce Ventures Ltd. operates in three segments: Retail, Marketplace, and Advertising. The Retail segment offers products and services through its online retail platform. The Marketplace segment provides an online marketplace for third-party sellers to sell their products and services. The Advertising segment offers online advertising services. FSN E-Commerce Ventures Ltd. has a market cap of 542.98B as of 2022 and a Return on Equity of 4.81%.
– Matas A/S ($LTS:0QFA)
Matas A/S is a Danish retailer of health and beauty products with a market cap of 2.87B as of 2022. The company has a Return on Equity of 8.02%. Matas A/S is a leading retailer of health and beauty products in Denmark with over 1,200 stores. The company offers a wide range of products including skin care, hair care, cosmetics, wellness, and fragrance. Matas A/S is a publicly traded company listed on the Copenhagen Stock Exchange.
– Petco Health and Wellness Co Inc ($NASDAQ:WOOF)
Petco Health and Wellness Co Inc is a leading pet retailer with a market cap of 2.83B as of 2022 and a Return on Equity of 6.12%. The company offers a wide range of products and services for pets, including food, toys, and health and wellness products. Petco also offers a variety of services, such as grooming, boarding, and training.
Summary
OLAPLEX HOLDINGS reported its financial results for the second quarter of 2023, with total revenue of USD 109.2 million and net income of USD 6.2 million. This represents a decline in both revenue and income of 48.2% and 93.0%, respectively, compared to the same quarter last year. As expected, the stock price of OLAPLEX HOLDINGS dropped on the same day.
Investors should be cautious when considering investing in OLAPLEX HOLDINGS due to its steep decline in revenue and income in the second quarter of this fiscal year and the uncertain economic environment. It would be advisable to further research the company’s financials before investing.


