NGL Intrinsic Value Calculation – NGL ENERGY PARTNERS LP Reports Earnings Results for FY2024 Q1 Ending on June 30, 2023
August 20, 2023

☀️Earnings Overview
On August 9 2023, NGL ENERGY PARTNERS LP ($NYSE:NGL) announced its financial results for the first quarter of FY2024, which ended on June 30 2023. The total revenue for the quarter was USD 1616.1 million, a decrease of 35.3% compared to the same quarter in FY2023. Net income for the quarter saw a year-over-year decline of 15.6%, amounting to USD 19.3 million.
Share Price
NGL Energy Partners LP reported its earnings results for the 1st quarter of FY2024 ending on June 30, 2023, on Wednesday. The company’s stock opened at $4.4 and closed at $4.4, up by 2.3% from last closing price of 4.3. This positive development in the company’s stock price suggests increasing investor confidence in NGL Energy Partners LP’s financial performance and future prospects. The 1st quarter of FY2024 proved to be a successful one for the company, as it reported impressive earnings figures. This impressive growth was credited to the company’s strong operational performance and its well-executed strategies.
The company has announced that it plans to expand its operations and this will be one of its key focuses in the upcoming quarters. It also aims to invest more in capital expenditures and expand its portfolio of assets. Furthermore, NGL Energy Partners LP is actively looking for new opportunities to drive long-term growth and value for its shareholders. With these strategic plans in place, the company is well-positioned to capitalize on future growth prospects and further strengthen its position in the energy industry. Live Quote…
About the Company
Income Snapshot
Below shows the total revenue, net income and net margin for NGL. More…
| Total Revenues | Net Income | Net Margin |
| 7.81k | -83.03 | 1.6% |
Cash Flow Snapshot
Below shows the cash from operations, investing and financing for NGL. More…
| Operations | Investing | Financing |
| 497.81 | 99.17 | -590.01 |
Balance Sheet Snapshot
Below shows the total assets, liabilities and book value per share for NGL. More…
| Total Assets | Total Liabilities | Book Value Per Share |
| 5.31k | 4.52k | 5.84 |
Key Ratios Snapshot
Some of the financial key ratios for NGL are shown below. More…
| 3Y Rev Growth | 3Y Operating Profit Growth | Operating Margin |
| 6.0% | 19.1% | 3.8% |
| FCF Margin | ROE | ROA |
| 4.5% | 18.1% | 3.5% |
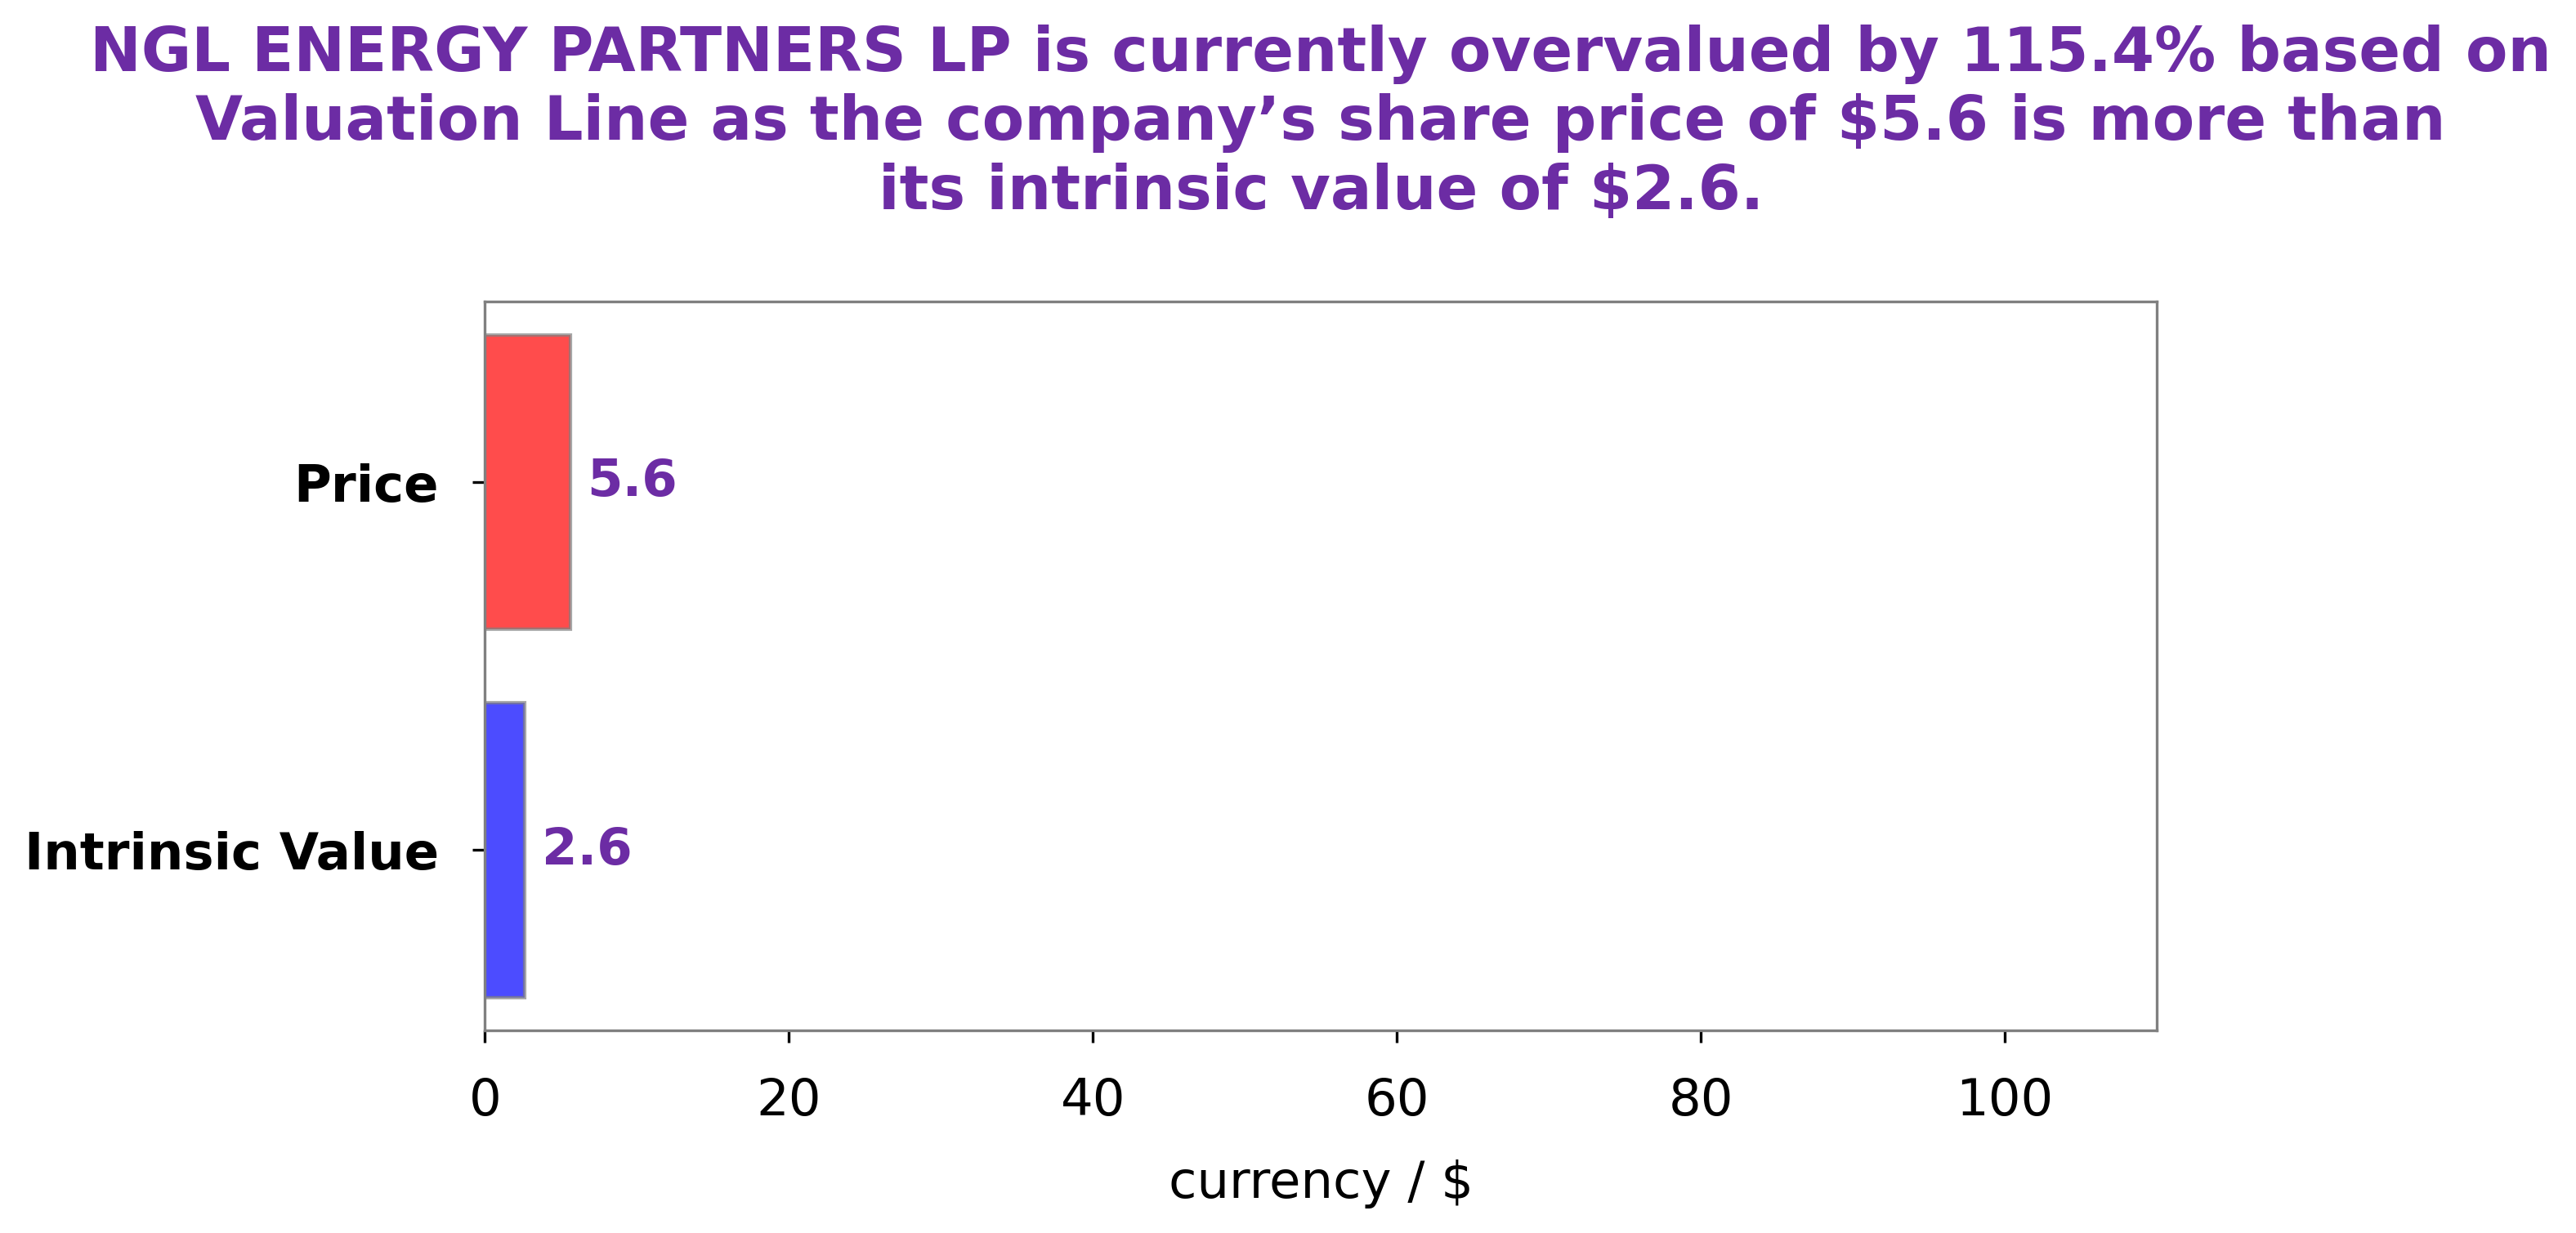
Analysis – NGL Intrinsic Value Calculation
At GoodWhale, we recently conducted an analysis of NGL ENERGY PARTNERS LP’s wellbeing. Our proprietary Valuation Line tool was used to calculate the fair value of the company’s shares, and the results indicated a fair value of approximately $2.6. However, at the time of writing, the stock is being traded at $4.4. This means that the stock is currently overvalued by 66.9%. It is important for investors to understand the true value of stocks before investing, especially when there is a discrepancy between the fair value and the trading price. Ultimately, it is the responsibility of investors to make informed decisions about the stocks they choose to invest in. GoodWhale is here to provide guidance and resources to assist with this process. More…
Peers
The Partnership’s operations are primarily conducted through its wholly owned subsidiaries. NGL Energy Partners LP is one of the largest providers of midstream energy services in North America. The Partnership has a diversified portfolio of assets that provide services to producers and end users of natural gas liquids (“NGLs”), crude oil, refined products and petrochemicals. The Partnership’s assets include: natural gas liquids pipelines, storage facilities, fractionators, railcars, barges, trucks, and related transportation and logistics assets.
– Energy Transfer LP ($NYSE:ET)
Energy Transfer LP is a publicly traded limited partnership that owns and operates energy infrastructure assets in the United States. The company has a market capitalization of $38.68 billion as of 2022 and a return on equity of 14.71%. Energy Transfer’s business segments include natural gas, natural gas liquids, crude oil, and refined products. The company’s natural gas segment includes interstate and intrastate natural gas transportation and storage assets, as well as natural gas gathering and processing assets. Energy Transfer’s natural gas liquids segment consists of natural gas liquids transportation, storage, and fractionation assets. The company’s crude oil segment includes crude oil transportation and storage assets, as well as crude oil gathering and marketing assets. Energy Transfer’s refined products segment includes refined products transportation and storage assets.
– Kinetik Holdings Inc ($NASDAQ:KNTK)
Kinder Morgan Inc is one of the largest energy infrastructure companies in North America. They own an interest in or operate approximately 84,000 miles of pipelines and about 180 terminals. The company transports natural gas, crude oil, refined petroleum products, and CO2. They also store and handle petroleum products, chemicals, and other bulk liquids.
Summary
NGL Energy Partners LP has posted a disappointing financial report for the first quarter of FY2024. Revenue was down 35.3% from the same period the previous year, while net income dropped by 15.6%. This is a sign that investors should be cautious when considering NGL Energy Partners LP, and should conduct thorough due diligence before investing.
They should analyze the company’s financials, growth strategies and outlook to assess the risks involved. With a close eye on the market conditions and the company’s performance, investors can decide if this company is worth investing in or if the risks are too high.


